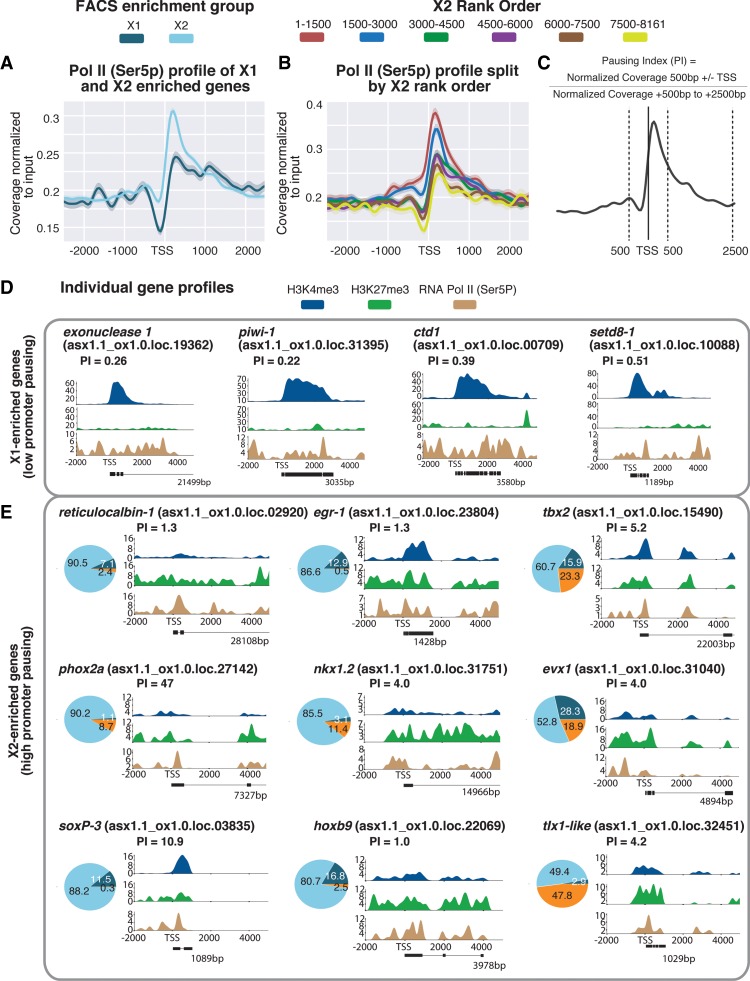
Figure 5.
(A) Average paused RNAPII-Ser5P ChIP-seq profile across X1- and X2-enriched loci in X1 NBs across biological replicates following outlier removal. The y-axis represents the difference in coverage between sample and input, and the x-axis represents signal 2.5 kb upstream of and downstream from the TSS. (B) RNAPII-Ser5P ChIP-seq profiles following outlier removal for X2 genes from high to low X2 proportional ranking. RNAPII-Ser5P signal increases with an increase in proportion of X2 gene expression, indicative of these high-ranking X2 genes being transcriptionally silenced but maintained in a permissive state for rapid induction. (C) Calculation for pausing index (PI) of genes ≥1 kb. We divided normalized coverage between ±500 bp TSS by normalized coverage +500 bp to +2.5 kb. For genes <2.5 kb, we inspected RNAPolI-Ser5P profiles visually to confirm whether Pol II pausing was enriched at the promoter-proximal region. (D) Individual profiles for H3K4me3 and H3K27me3 of highly enriched NB X1 genes. X1 genes have a high level of H3K4me3, and levels of H3K27me3 correspond to intron regions and are not enriched at the promoter-proximal region. RNAPII-Ser5P signal is not enriched at the promoter-proximal region compared with the gene body; as a result, PI <1. (E) We selected highly enriched X2 genes with a PI ≥1 that have both H3K4me3 and H3K27me3 enriched at the promoter-proximal region, together with an enrichment of RNAPII-Ser5P close to the TSS. Pie charts represent proportional expression for each gene in X1 (dark blue), X2 (light blue), and Xins (orange).

