Figure 1.
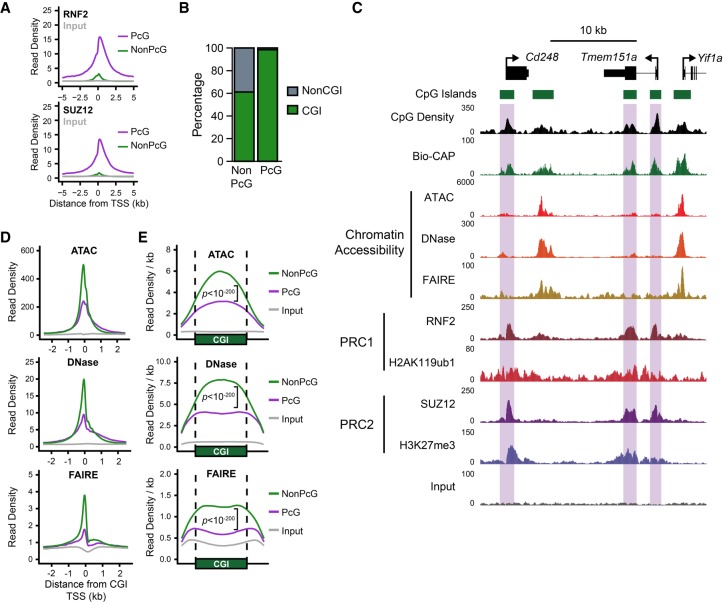
Polycomb-occupied promoters exhibit reduced chromatin accessibility compared to Polycomb-free promoters. (A) A metaplot analysis comparing RNF2 (PRC1; upper) and SUZ12 (PRC2; lower) ChIP-seq signal at Polycomb (PcG)-occupied promoters or PcG-free (non-PcG) promoters in mouse embryonic stem cells (ESCs), centered on transcription start sites (TSSs). (B) A comparison of the percentage of PcG and non-PcG TSSs (±500 bp) that overlap with experimentally identified nonmethylated CpG islands (CGIs). (C) A genome screenshot of several PcG-occupied promoters (highlighted in purple boxes) profiling three measures of chromatin accessibility: ATAC-seq, DNase-seq, and FAIRE-seq. CpG density and nonmethylated DNA (measured by Bio-CAP), in addition to PRC1 and PRC2 ChIP-seq, are included for reference. (D) A metaplot analysis comparing ATAC-seq, DNase-seq, and FAIRE-seq signal at PcG-occupied (n = 4020) or PcG-free (n = 10,251) CGI promoters, centered on TSSs. Input for ATAC-seq and DNase-seq represents digestion of naked genomic DNA by Tn5 or DNase I, respectively. (E) A metaplot analysis at CGI intervals (±20%) for CGI-positive TSSs with (PcG) or without (NonPcG) for ATAC-seq, DNase-seq, and FAIRE-seq signal, normalized to CGI interval size. P-values represent comparison of reads per kilobase per million (RPKM) at PcG-bound CGI promoter intervals compared to non-PcG CGI promoters.

