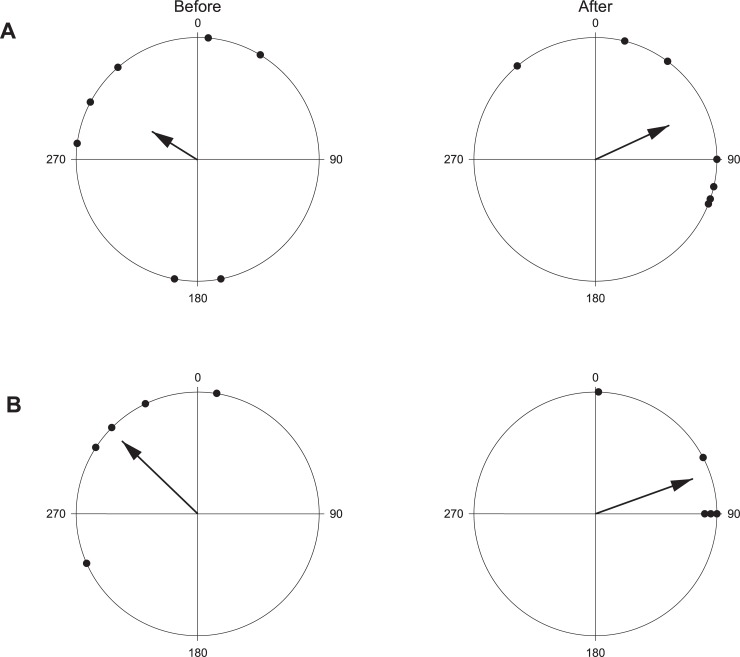
Fig 4.
Polar plots showing the anterior/posterior orientation at the BUV (A) just prior to John Dory sound and (B) as they swam out of the camera range following John Dory sound. In both instances John Dory entered the frame from approximately 200°. Orientations for A and B were significantly different before and after [Watson-Williams F-test (A- P = 0.022; B-P = 0.003)].

