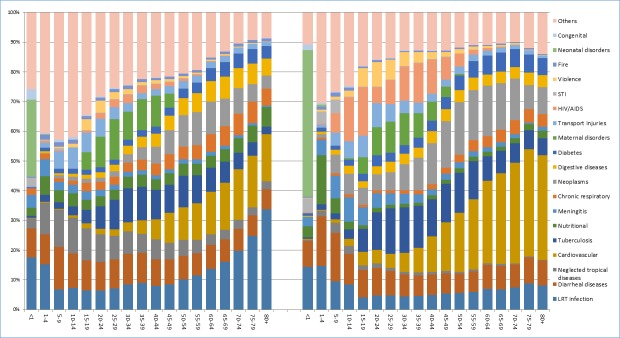
Fig 1. The distribution of age-cause specific proportion of deaths across abridged age groups in Ethiopia, 1990, 2015.
This figure illustrates the mortality proportion for each specific cause of disease across a five year abridged age category in the horizontal axis, except for age under one and under five where age intervals are one year and four year respectively. The left graph indicate the data for 1990 and the right one indicate the data for 2015 estimate based on the global burden of disease study.

