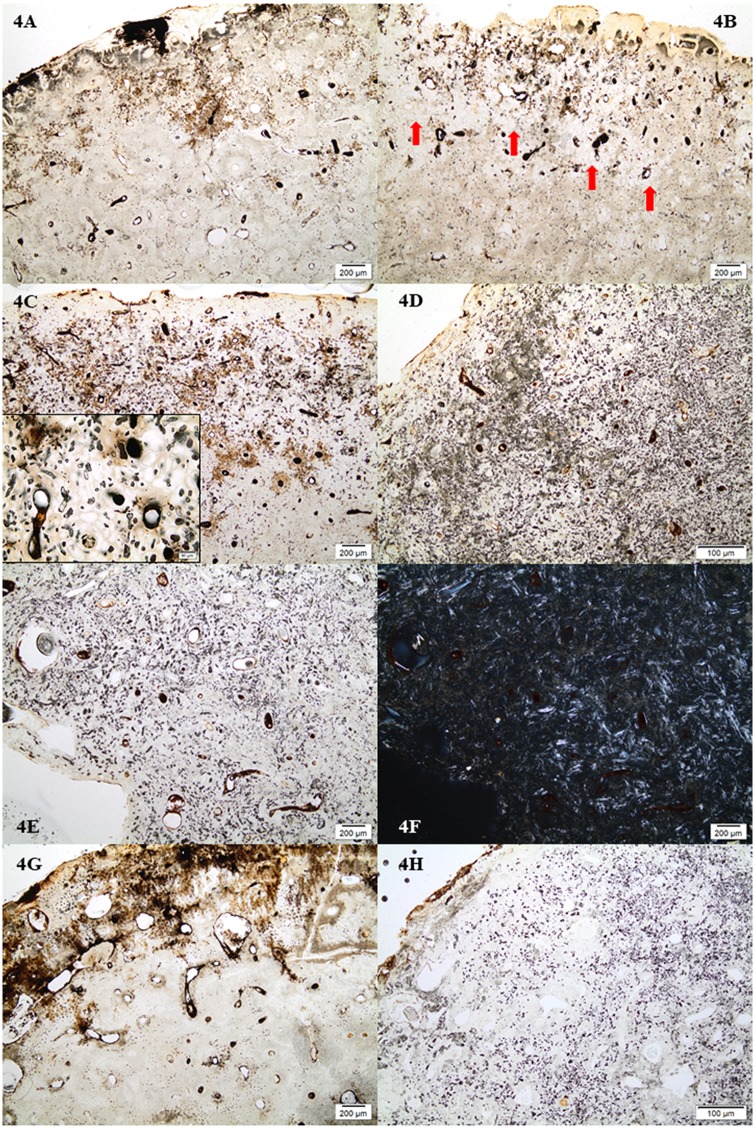
Fig 4. Micrographs showing the patterns of bioerosion and associated staining/inclusions observed.
4A) Sample from TB18 with no bioerosion (M49); 4B) Sample from TB18 with arrested bioerosion (M37). The densest bioerosion is seen in an area close to the periosteal surface, here seen as white spots which are holes left after etching of the localized areas of microbial destruction. Red arrows indicate areas of severe bioerosion; 4C) Sample from TB31 with arrested bioerosion (TB31F). The insert shows the bioerosion at higher magnification where it is possible to discern mfds that are etched and empty, and others that are filled with minerals; 4D) Sample from TB31 with extensive bioerosion (TB31A); 4E) Samples from TB31 with OHI of 2, but with an overall appearance of an extensively bioeroded bone (TB31D); 4F) as 4E but in polarized transmitted light. The bright birefringent areas are the pockets of well-preserved bone; 4G) Sample FÖ1C with no bioerosion; 4H) Sample FÖ1A with extensive bioerosion.

