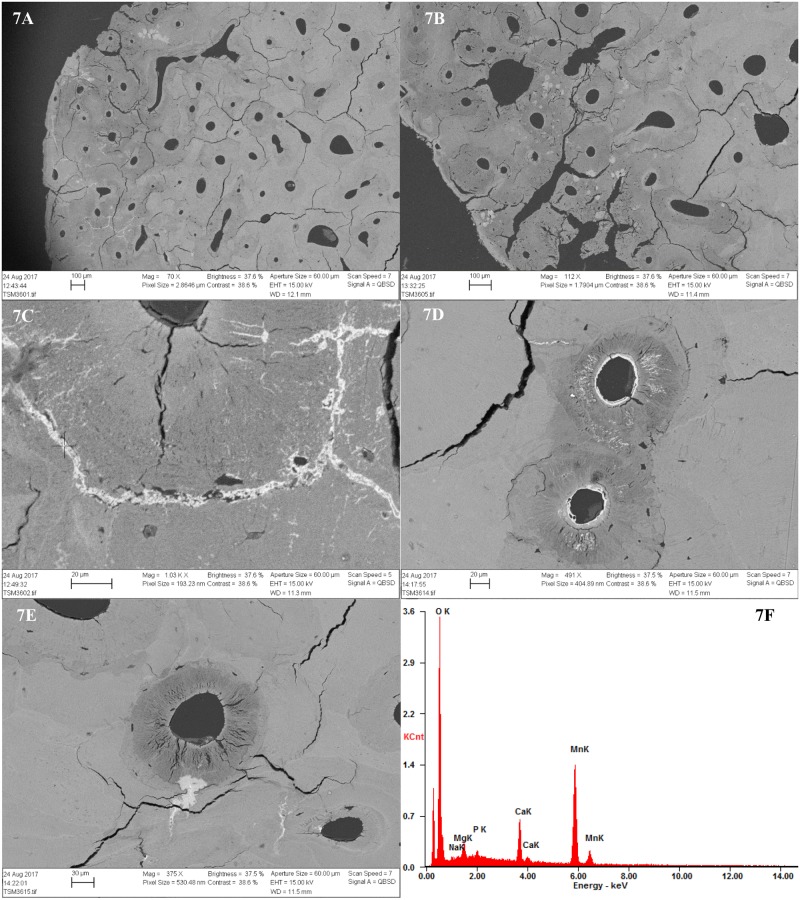
Fig 7. SEM-BSE images and SEM-EDX elemental profiling of dark stains and inclusions observed.
7A-7B) SEM-BSE image of M36 (no bioerosion) showing bright stains and inclusions within cracks and canals. The lighter grey and white colour is evidence of higher density; 7C) Detail of infilled crack. The cross shows the spot where one of the chemical analyses where carried out; 7D-7E) Further details of manganese stains and inclusions within sample M36. Note also the demineralised bone, cracks and stained/enlarged canaliculi, filled with manganese. 7F) SEM spectrum showing the result of the analysis. Manganese (Mn) was detected.

