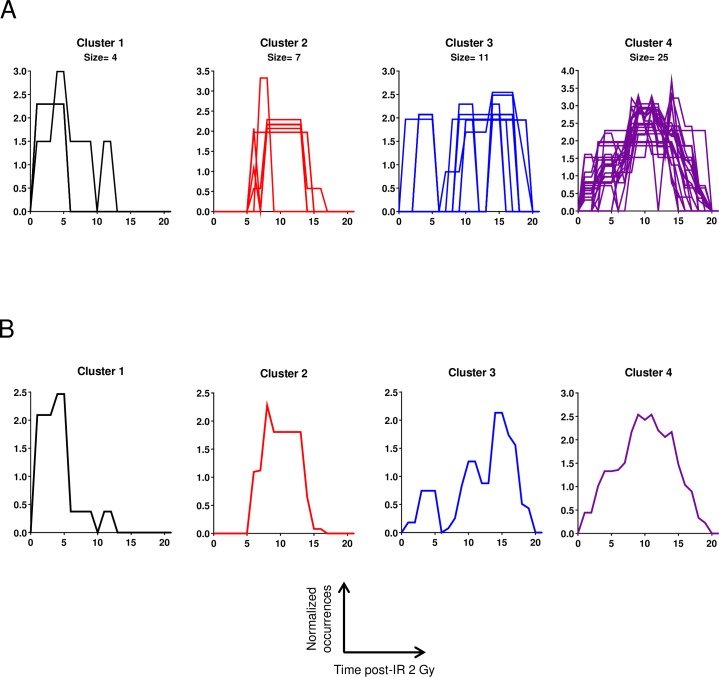
Fig 7. Profiles of transcription factor occurrences.
(A) Occurrences of predicted associated factors were normalized, plotted as a function of time post-irradiation and clustered as described in the text, allowing the identification of four main occurrence profiles called cluster 1, cluster 2, cluster 3 and cluster 4. (B) Representative TF occurrence profiles.

