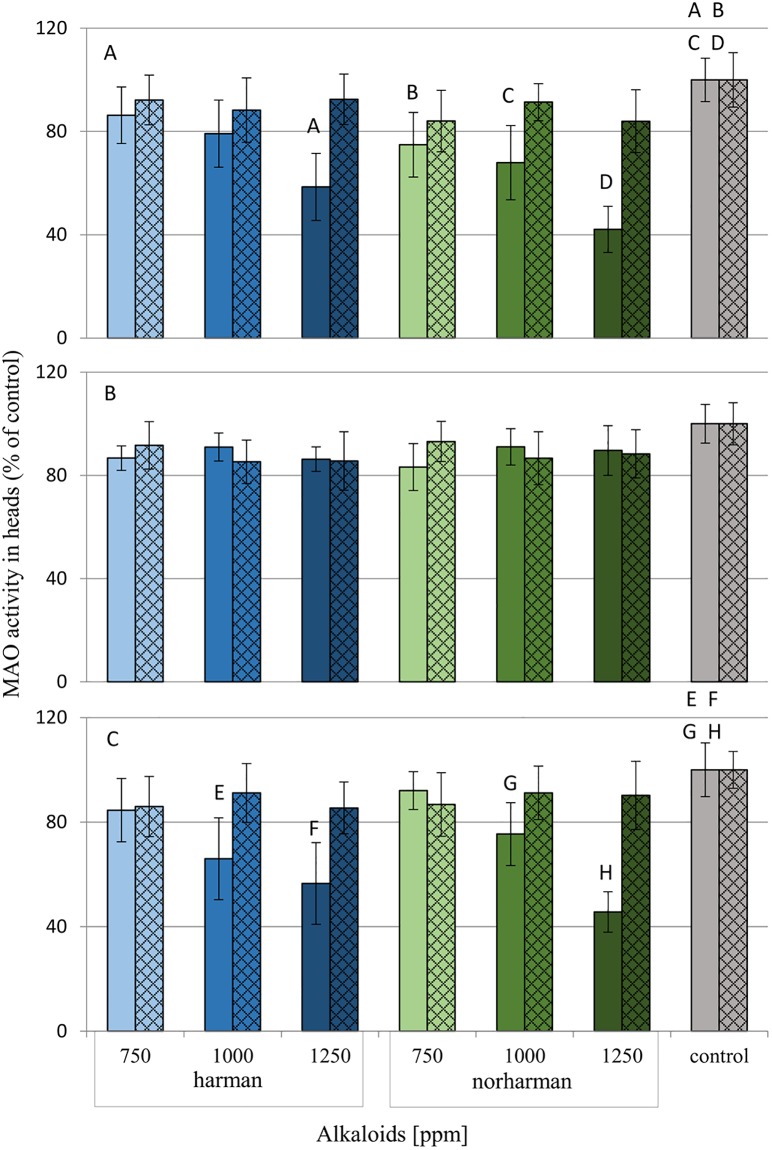
Fig 9. Effect of harman and norharman on MAO-A and MAO-B activity in the heads of G. mellonella larvae.
Data are expressed as mean ± SD; empty bars- MAO-A activity; hatched bars- MAO-B activity. Data are presented as a percentage of the activity, control was taken as 100%. A-larvae after one hour from topical application. B- larvae after 24 hours from topical application. C- larvae after 24 hours from application with food. statistically significant differences as compared to control was marked with the same letters, P≤0.05.

