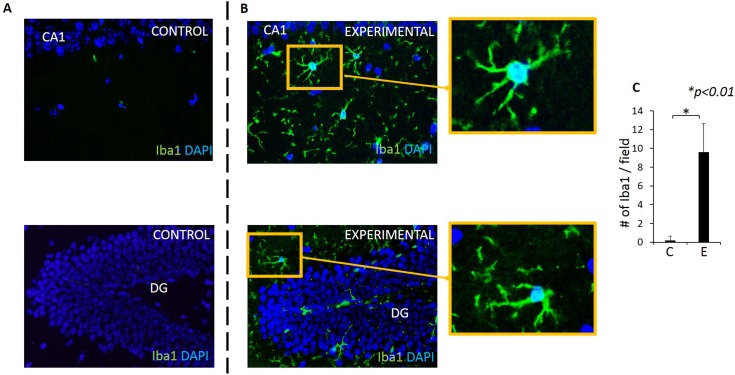
Fig 11. Microgliosis is observed in both CA1 and DG regions of experimental but not control mice.
Microglia (Iba1+ cells) in CA1 and DG regions in control (A) and experimental (B) mice. Blue: DAPI, Green: Iba1+ /microglia. (C) A significantly higher number of microglia are present in the experimental group compared with control group. Y-axis: number of microglia counted in a rectangular area (220μm X 160μm) in the hippocampus in 5 fields/sample. N = 5 mice/group. X-axis: C: control, E: experimental group.

