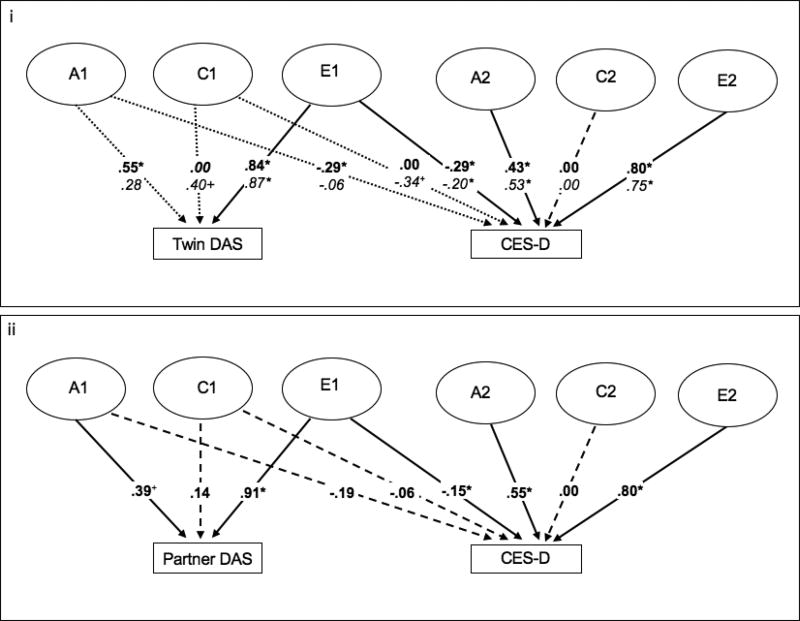
Figure 1.
Cholesky decomposition of depressive symptoms with twin-reported dyadic adjustment (panel i) and partner-reported dyadic adjustment (panel ii). The figure depicts the model for one twin. However, the Cholesky decomposition estimates the same model for both twins, and constrains the correlation between A of Twin 1 and Twin 2 to be 1 in MZ twins to reflect that MZ twins share 100% of their genes, and .5 in DZ twins to reflect that DZ twins share 50% of their segregating genes on average. The correlation between C of Twin 1 and Twin 2 is constrained to 1 to reflect that all twins share a common environment. In panel i, parameters are presented separately for men and women, with men in bold and women in italics. In panel ii, parameters were constrained to be equal across men and women. Dashed lines indicate nonsignificant paths. In panel i, dotted lines indicate paths that are significant in one sex and nonsignificant in the other. Ellipses indicate latent variables, and rectangles indicate observed variables. A1=additive genetic influences common to both the DAS and the CES-D; A2=additive genetic influences specific to the CES-D; C1=shared environmental influences common to the DAS and CES-D; C2=shared environmental influences specific to the CES-D; E1=nonshared environmental influences common to the DAS and CES-D; E2=nonshared environmental influences specific to the CES-D; DAS=Dyadic Adjustment Scale; CES-D=Center for Epidemiologic Studies Depression Scale. * p < .05. + p < .10.

