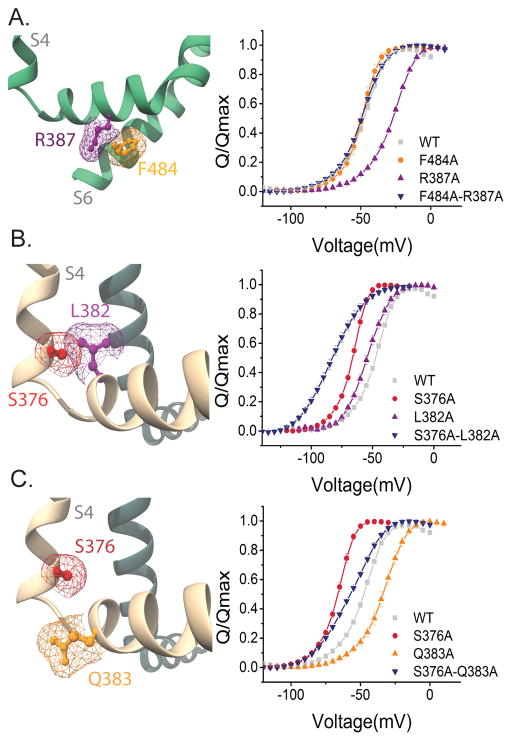
Figure 2. Interaction energy analysis residues in the intracellular gating interface.
(A) (Left panel) Side view of the F484 (orange) and R387 (purple) mapped on Kv 1.2/2.1 chimera structure. Only the S4–S5 and S6 domains of the same subunit are shown for clarity. (Right panel) Normalized Q-V curves of WT (grey squares), R387A (purple triangles), F484A (orange circles) and R387A-F484A (blue inverted triangles). (B) (Left panel) Side view of the S376 (red) and L382 (purple). The S376 residue is at the end of the S4 segment and the L382 is at the beginning of the S5 segment in the neighboring subunit. (Right panel) Normalized Q-V curves of WT (grey squares), L382A (purple triangles), S376 (red circles), S376A-L382A (blue inverted triangles). (C) (Left panel) Side view of the S376 (red) and Q383 (orange), which is at the start of the S4–S5 linker. (Right panel) Normalized Q-V curves WT (grey squares), S376 (red circles), Q383A (orange triangles), and S376A–Q383A (blue inverted triangles). Mesh (A–C) represents the surface based on the Van der Waals radii for selected atoms. Error bars represent SEM in all Q-V plots.

