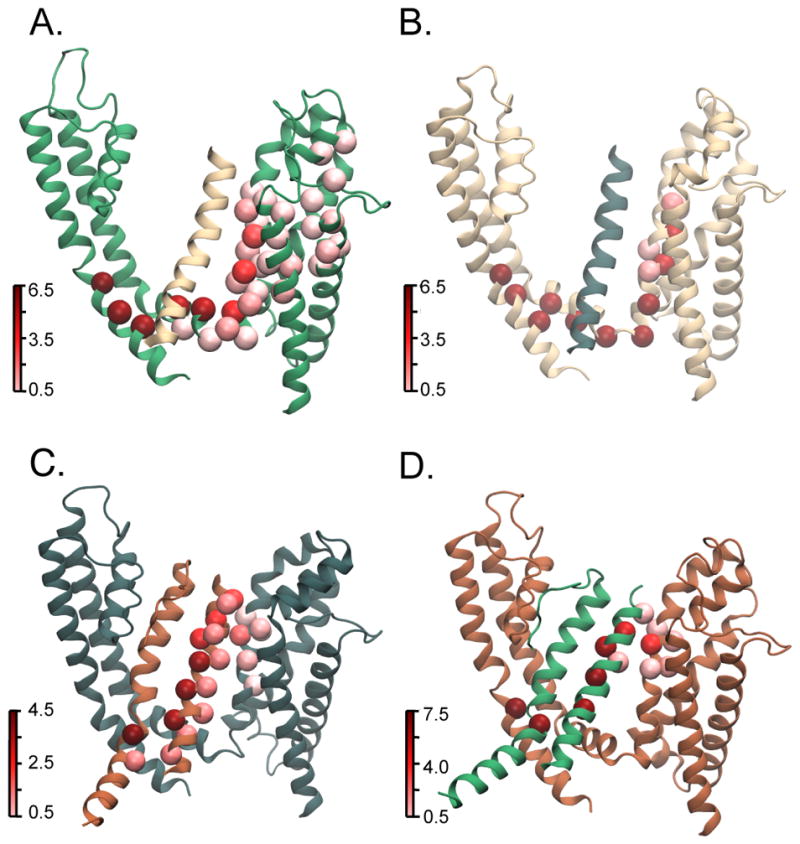
Figure 5. Residue betweenness for pathways between S4 and S6 in the activated/open state.

Betweenness is a measure of centrality of a residue in various allosteric pathways that link source and sink residues in that it calculates the number of shortest paths a residue is on. Residues with higher betweenness are hubs in the network and are therefore important for information flow along the network. Betweenness is calculated for residues of each individual subunit since in MD simulations, each subunit will evolve differently over time due to the stochasticity inherent in this process. (A–D) Each panel represents one of the four subunits where the subunit colors, source and sink residues were selected following the convention described in Fig. 1. Residue betweenness for each subunit is mapped on to the activated state structures. It is calculated using source residues where the c-α is, on average, within 9 Å of Arg 365 (R2). Residues with high betweenness are shown in dark red whereas low betweenness residues are shown in light red. In the top two panels showing subunits A and B, residues of high betweenness are within a single subunit and travel down S4 and along the S4–S5 linker finally linking up with the gate residues in the S6 subunit. In the bottom two panels showing subunits C and D, residues of high betweenness are on multiple subunits and travel from S4 to the neighboring subunit S5 then down the S5 helix. In these panels, the S6 helix of the neighboring subunit is also shown to identify the position of the sink residue. The intersubunit pathway remains consistent whether the sink residue is on the same or the adjacent subunit (Supplementary Fig. 4 G,H).
