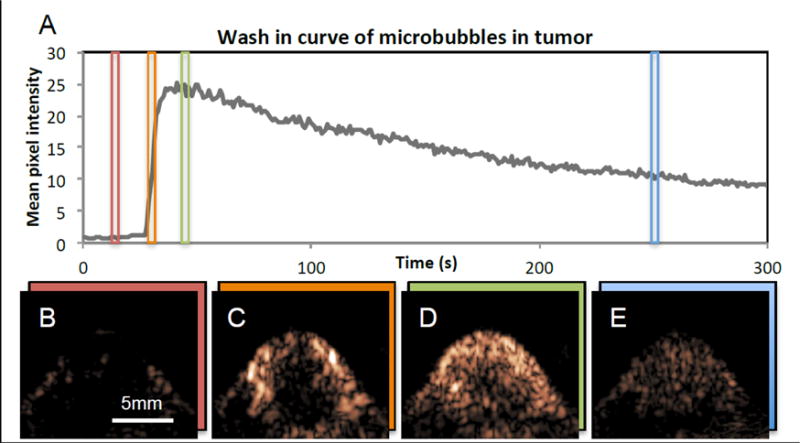
Figure 7.

In vivo plane-wave pulse inversion imaging of MBs in mouse with tumor. Microbubbles were injected at the 27 s mark, and the images were collected over a period of 300 seconds. A) Time activity curve of signal inside ROI drawn over tumor. B) Tumor image obtained at t = 15 s, prior to MB injection. C) Tumor image obtained at t = 31 s, immediately after MB injection. D) Tumor image obtained at 46 s, when MB signal has peaked. E) Tumor image obtained at 250s, after much of the MBs has washed out.
