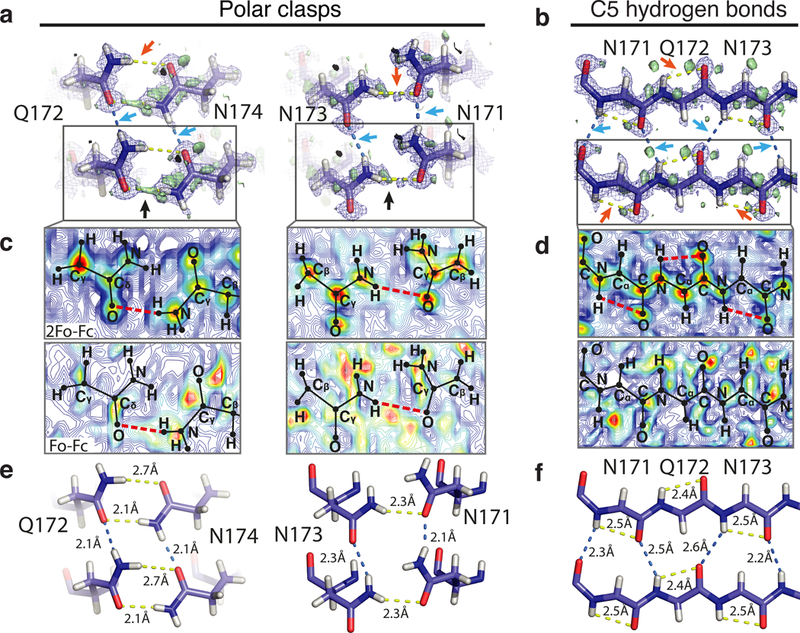
Figure 3.

Sub-Å cryo-EM maps show stabilizing hydrogen bonds in proto-PrPSc. a, Polar clasps formed by hydrogen bonds that link Q172 to N174, and N171 to N173, and b, C5 hydrogen bonds (orange arrows) in the context of backbone hydrogen bonds at the core of proto-PrPSc. Bridging density can be seen in both the 2Fo-Fc and Fo-Fc maps (blue mesh and green isosurface respectively) for a subset of the hydrogen bonds (black arrows). Contour maps show 2Fo-Fc or Fo-Fc density for c, polar clasps or d, C5 bonds. Contours are averaged over a ~1.5Å thick volume with high contour values are shown in red, low values in blue, and hydrogen bonds as dashed red lines. Distances for both intra (yellow lines) and inter (blue lines) chain hydrogen bonds are highlighted in e, polar clasps or f, C5 bonds.
