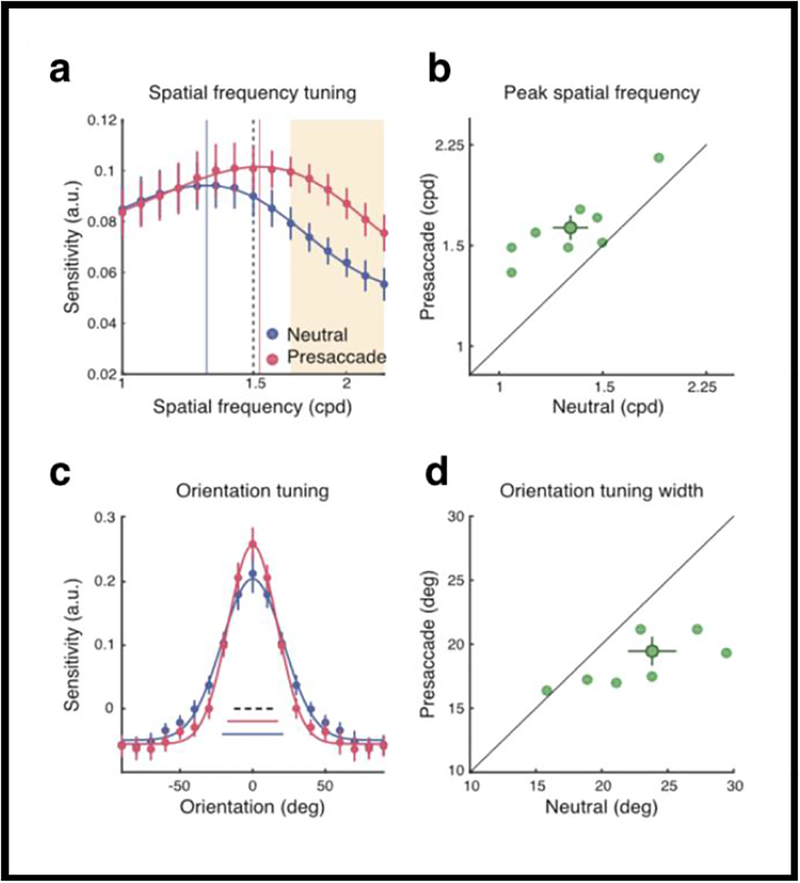
Figure 9.
Saccade Preparation Reshapes Sensory Tuning (a) Group-averaged SF tuning functions. Error bars denote ±1 SEM. The vertical lines represent the peak frequency. The dashed line represents the target Gabor. The orange shaded area represents the cluster of SF channels that showed a significant difference between the two conditions. (b) The peak frequency of the presaccadic interval was plotted against the peak frequency of the neutral condition. The dark green data point and error bars represent group mean and ±1 SEM. The light data points represent individual parameter fits. (c) Group-averaged orientation tuning functions. Error bars denote ±1 SEM. The three horizontal bars at the bottom denote the fitted tuning widths (±1 s; the dashed line denotes the width of the target Gabor). (d) The presaccadic tuning width was plotted against the neutral tuning width. The dark data point and error bars represent group mean and ±1 SEM. The light data points represent individual parameter fits. (Reprinted from Li, Barbot & Carrasco, Fig. 4)

