. 2018 Sep 26;7:e36330. doi: 10.7554/eLife.36330

Figure 2. mRNA profiling and analysis of gene expression of cells treated with Wnt3a.

(A-B) HeLa-MZ cells were treated with control- or Wnt3a-conditioned media for 2 hr or 6 hr before RNA isolation and RNAseq analysis. Panel (A) shows the pathway enrichment of perturbed mRNAs. Node size indicates number of genes in each ontology and colour the statistical strength of the enrichment. Edge thickness indicates the strength of overlap of related ontologies. From (A), the fold change of transcription factors amounts in response to Wnt3a is shown in panel B. C. The ability of TFAP2 family member TFAP2A to bind to regulatory regions of lipid droplet at lipid metabolic enzyme genes was tested by ChIP-qPCR (see Materials and methods). Data are presented as the mean DNA amounts normalized to the negative control (CTCF) of three independent experiments ± SEM. (*) indicates a p-value<0.05; (**) indicates a p-value<0.005. Inset; re-scaled view of signal of the control conditions.

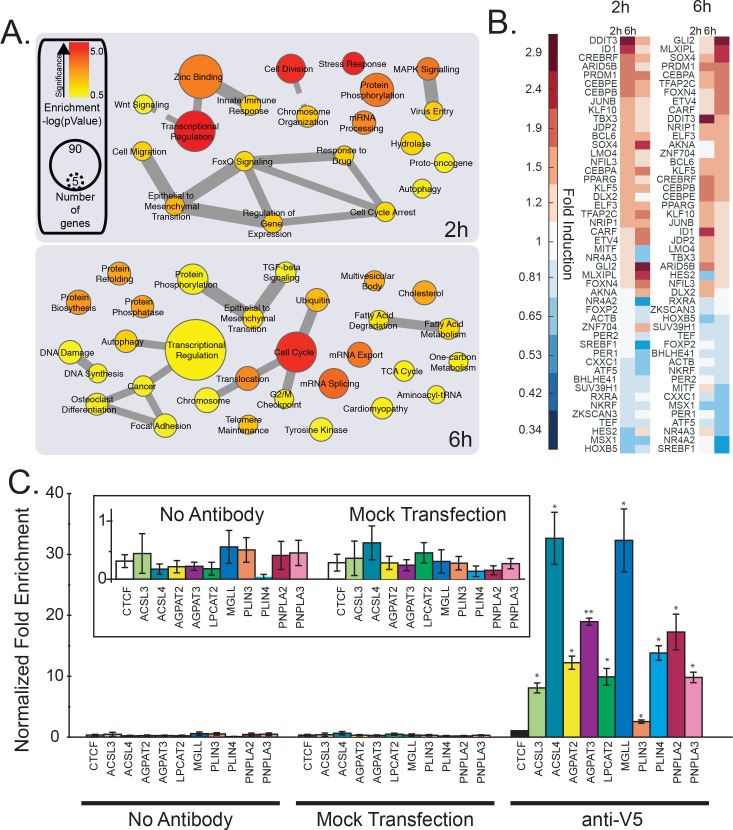
Figure 2—source data 1. Effect of silencing transcription factors on cellular cholesterol amounts.
DOI: 10.7554/eLife.36330.010
Figure 2—source data 2. Comparative enrichment of transcriptional targets in cells treated with Wnt3a or fatty acid perturbation.
elife-36330-fig2-data2.xlsx (152.5KB, xlsx)
DOI: 10.7554/eLife.36330.011
Figure 2—source data 3. TFAP2 family member consensus binding sites in lipid droplet genes.
elife-36330-fig2-data3.xlsx (114.4KB, xlsx)
DOI: 10.7554/eLife.36330.012

Figure 2.

Figure 2—figure supplement 1. Datamining for putative lipid droplet transcriptional regulators.

Figure 2—figure supplement 1.

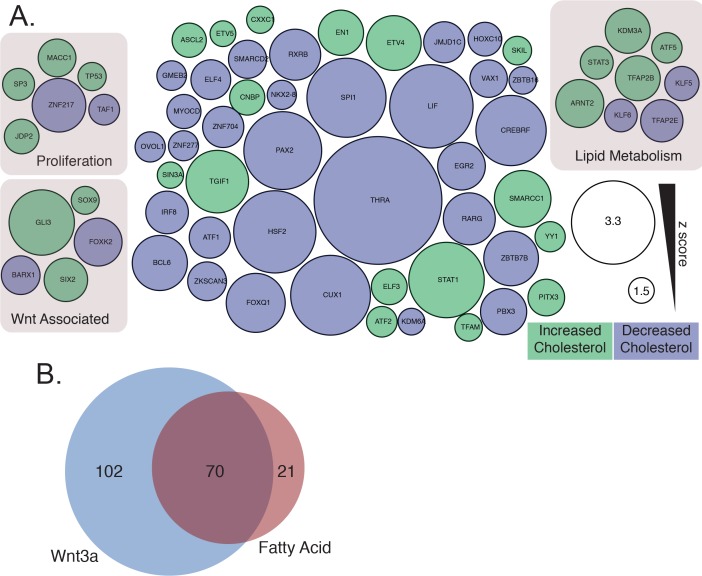
(A) Transcription factors that influence cellular cholesterol amounts from a genome-wide screen of cholesterol regulatory genes (Scott et al., 2015). Node size is proportional to the absolute z-score difference from the control, and the color indicates increased (green) or decreased (blue) cellular cholesterol levels. (B) Existing mRNA profiling experiments of cells treated with Wnt3a (blue), or perturbations likely to induce lipid droplet accumulation (see Materials and methods) (pink), were analyzed for enrichment of genes linked to known transcriptions factors to identify candidate transcription factors linking Wnt3a to lipid droplet biogenesis.

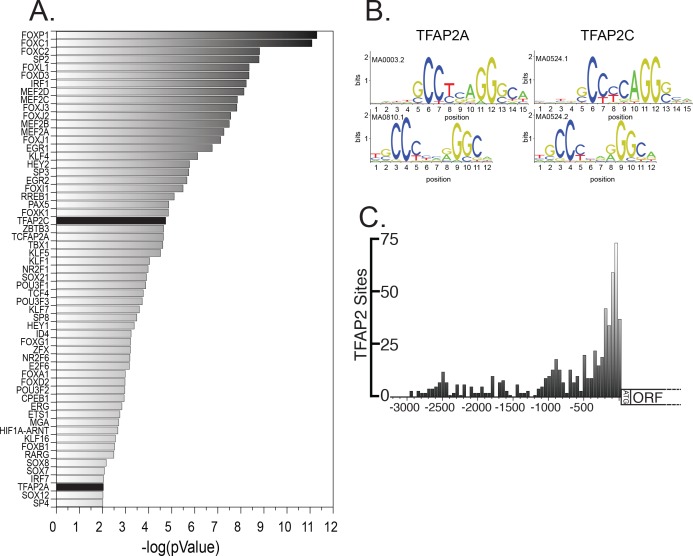
Figure 2—figure supplement 2. The consensus binding sites of TFAP2 family members are overrepresented in lipid droplet genes.

Figure 2—figure supplement 2.

(A) Enrichment of known transcription factor consensus sequences in lipid droplet genes. (B) TFAP2A and TFAP2C consensus binding site motifs. (C) Distribution of TFAP2 consensus sites in the promoter region of genes annotated to be lipid droplet related.

Figure 2—figure supplement 3. Effect of Wnt3a on DDIT3 protein and mRNA amounts in L Cells.

Figure 2—figure supplement 3.

Cells were treated with control- or Wnt3a-conditioned media for the indicated times before lysis. A. mRNA was extracted from L Cells cells and amounts were determined by qPCR. B. Cell extracts were analyzed by SDS-PAGE and western blot using antibodies against the indicated proteins.

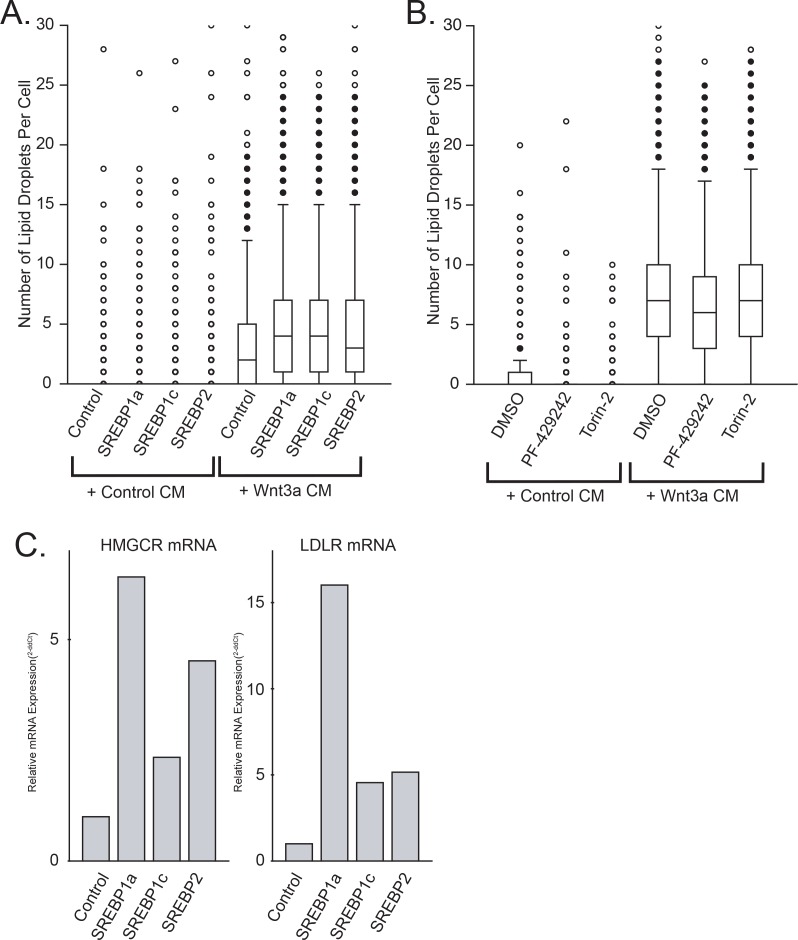
Figure 2—figure supplement 4. SREBF activity does not significantly influence lipid droplet number.

Figure 2—figure supplement 4.

(A) L Cells were transfected or not with constitutively active truncation mutants of SREBF1a, SREBF1c, and SREBF2 for 24 hr before addition of control- or Wnt3a-conditioned media for an additional 24 hr. Cells were fixed, labeled and imaged by automated microscopy as in Figure 1A. Data are box-and-whisker plots of a representative experiment. (B) L Cells were treated with the indicated chemical inhibitors simultaneously with the conditioned media, and processed as (A). PF-429242; inhibitor of the SREBF site one protease (S1P). Torin-2; mTOR inhibitor. (C) L Cells were transfected as in A before mRNA extraction and quantitation of HMGCR and LDLR mRNAs by qPCR.