
Figure 6. Ion binding in the open pore.
(a–c) Anomalous-difference electron density maps (mesh) for crystals of H206A Oraicryst with Ba2+ (a), Gd3+ (b), and I- (c). M1 helices of two opposing subunits are shown as ribbons. Side chains proposed to line the pore (sticks) are drawn for reference; their conformations are hypothetical. The maps are contoured at 10 σ and calculated from 25 to 9 Å for (a–b), and at 7 σ and calculated from 25 to 10 Å for (c).

Figure 6—figure supplement 1. Comparison of the anomalous-difference electron-density peaks for Ba2+ and Gd3+ in the open and closed pores.
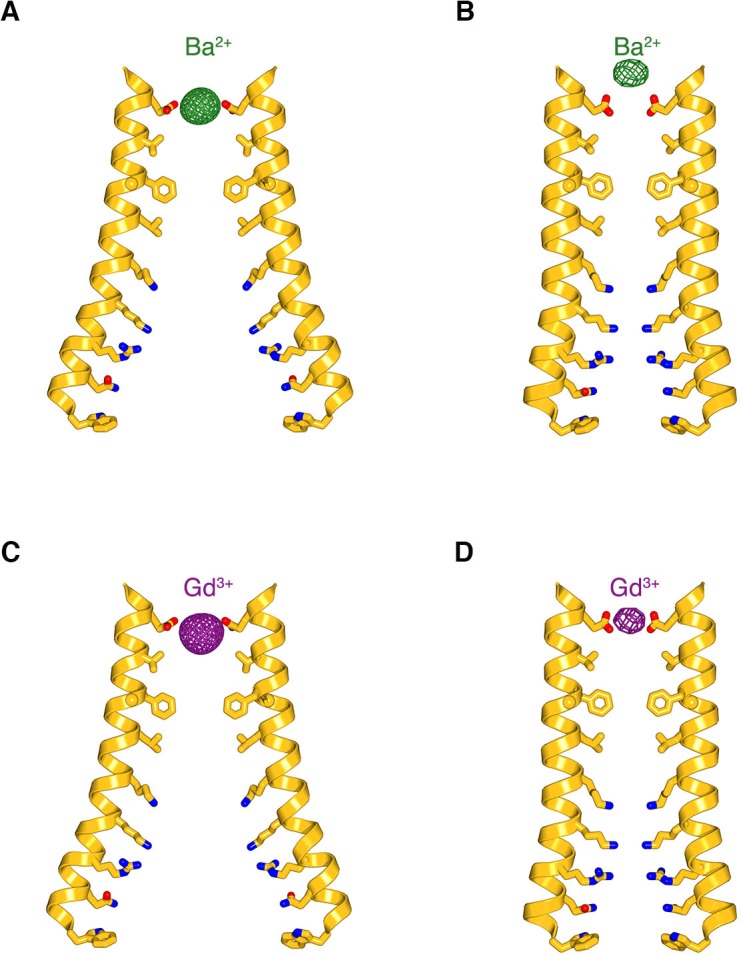
(a–b) Anomalous-difference electron density for Ba2+ (green mesh) in open pore of H206A Oraicryst (from Figure 5A) and in the closed pore of the quiescent conformation (from Hou et al., 2012), respectively. M1 helices (amino acids 148 to 180) are depicted from two opposite subunits as ribbon representations. Pore-lining side chains (sticks) are drawn for reference in (a) since their conformations cannot be determined due to the limits of the diffraction data, and they are shown in (b) according to their observed conformations (Hou et al., 2012). (c–d) Analogous depictions for the anomalous-difference electron-density peaks for Gd3+ in the open pore (c), from Figure 5B and closed pore (d), from Hou et al. (2012).