. 2018 Aug 30;7:e36758. doi: 10.7554/eLife.36758

Figure 9. The structure of WT Oraicryst reveals an unlatched-closed conformation.

(a) Electron density for WT Oraicryst, shown as blue mesh covering the channel (Cα representation). The map (contoured at 1.3 σ) was calculated from 20 to 6.9 Å using native sharpened amplitudes and phases that were determined by MR-SAD and improved by 24 fold NCS averaging, solvent flattening and histogram matching (Materials and methods). (b) Electron density, from (a) (blue mesh), covering two opposing subunits of WT Oraicryst (cartoon representation, colored as indicated in c). Anomalous-difference electron-density (from iron) in the basic region of the pore is shown as magenta mesh (map calculated from 25 to 9 Å and contoured at 5 σ). Conformations of pore residues are based on the quiescent conformation (PDB ID 4HKR). (c) Extracellular view of WT Oraicryst. Helices are drawn as ribbons and colored as indicated, with Glu178 side chains (sticks) and Ca2+ ion (green sphere) shown for reference. (d) Superposition of the quiescent conformation (PDB ID 4HKR) and the structure of the unlatched-closed conformation (WT Oraicryst). Two subunits of each channel are shown. The quiescent conformation is gray; the structure of WT Oraicryst is shown in colors. Amino acids lining the pore of the quiescent conformation are shown as sticks. A slight outward displacement of the intracellular side of M3 is observed in the structure of WT Oraicryst; otherwise the conformations of M1-M4a are indistinguishable within the resolution limits of the diffraction data (RMSD for Cα positions 148 to 288 is 0.9 Å). (e) Anomalous-difference electron-density peaks at cysteine and methionine residues confirms the amino acid register of the WT Oraicryst structure (stereo representation). An anomalous-difference electron-density map was calculated from 25 to 9 Å resolution from data collected with λ = 1.738 Å X-rays (Extended Data Table 2) using anomalous differences as amplitudes and phases from (a). This map was then averaged in real-space according to the 24-fold NCS symmetry to yield the map shown. The map is contoured at 5 σ (cyan mesh) and shown in the vicinity of a subunit of Orai (red Cα trace). Methionine and cysteine residues are shown as sticks (colored yellow for carbon and green for sulfur atoms). Methionine residues on M4b and M4-ext are labeled. Portions of neighboring Orai subunits (gray Cα traces) are shown for reference with their helices labeled in parentheses. Side chain conformations are hypothetical.

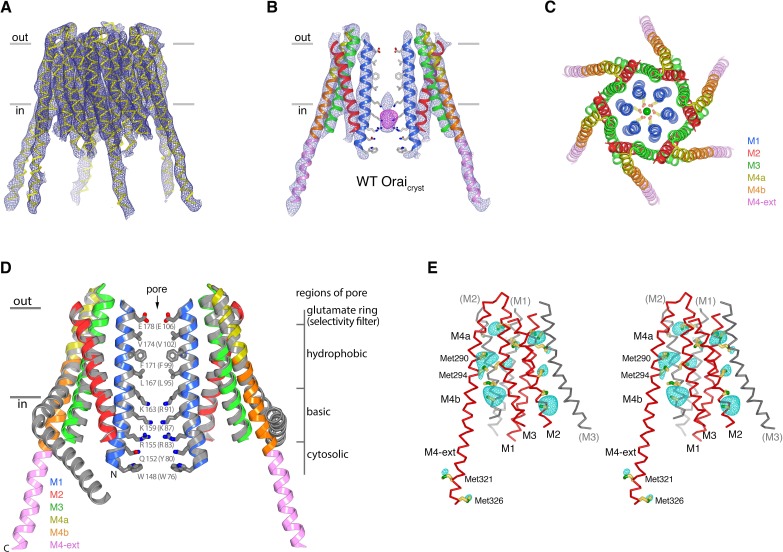
Figure 9.

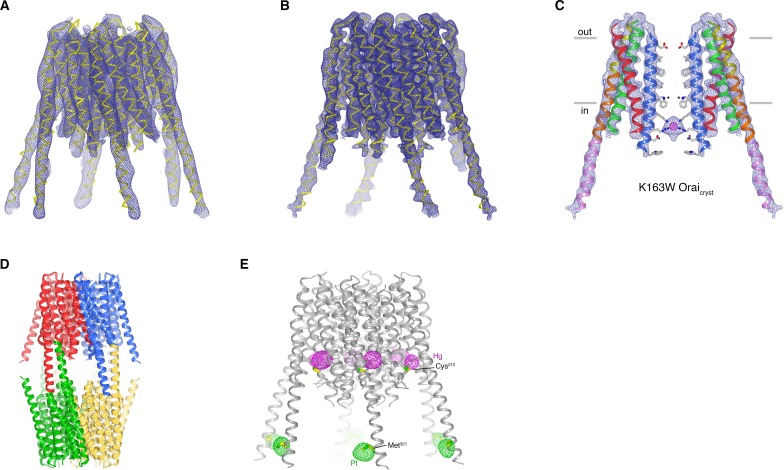
Figure 9—figure supplement 1. Structures of K163W Oraicryst in I41 and P42212 crystal forms (unlatched-closed conformation).

Figure 9—figure supplement 1.

(a) Structure of K163W Oraicryst from the I41 crystal form. The map (contoured at 1.3 σ) was calculated from 20 to 6.1 Å using native-sharpened amplitudes and experimental phases that were determined by MIRAS and were improved by 24-fold NCS averaging, solvent flattening and histogram matching (Materials and methods). The atomic model is shown in Cα representation (yellow). The crystal form is analogous to crystals of H206A Oraicryst and WT Oraicryst, and has analogous crystal packing. The root-mean-squared deviation (RMSD) for Cα positions between the structures of WT Oraicryst and K163W Oraicryst is 0.5 Å. (b) 4.35 Å resolution structure of K163W Oraicryst in the P42212 crystal form. Electron density (mesh) covering the channel is shown. The map (contoured at 1.3 σ) was calculated from 20 to 4.35 Å using sharpened amplitudes and phases that were determined by MR and were improved by threefold non-crystallographic symmetry (NCS) averaging, solvent flattening and histogram matching (Materials and methods). (c) Two opposing subunits of K163W Oraicryst (P42212 crystal form), showing the pore, with electron density from (b). Amino acids on the pore are depicted as sticks (conformations based on PDB 4HKS; Materials and methods). Anomalous-difference electron density in the pore is shown as magenta mesh (calculated from 30 to 8 Å resolution using anomalous differences as amplitudes, and contoured at 3.8 σ). Asterisks mark the locations of K163W substitutions. (d) Packing of K163W Oraicryst in the P42212 crystal form. The contents of each asymmetric unit (three Orai subunits) are colored a unique color. Two asymmetric units (e.g. blue and red) form a complete channel. The channels interact with one another in the crystal lattice via coiled-coil interactions between their M4-ext helices. (e) Anomalous-difference electron-density for heavy atom derivatives of K163W Oraicryst in the I41 space group. One channel of the asymmetric unit is depicted as ribbons. The map for the platinum (Pt) derivative (magenta mesh, calculated from 25 to 8.0 Å, and contoured at 4.5 σ) was calculated from data collected from a crystal soaked in PIP (Table 2), using anomalous differences as amplitudes and phases from (a). The analogous map for the mercury (Hg) derivative (green mesh, calculated from 25 to 8.0 Å, and contoured at 5 σ) was calculated from data collected from a crystal soaked in PCMB (Table 2). Each channel in the asymmetric unit has anomalous-difference density at these sites (24 sites for each derivative, Table 2). Cys215 and Met321 residues, to which the heavy atoms presumably bind, are depicted as sticks.