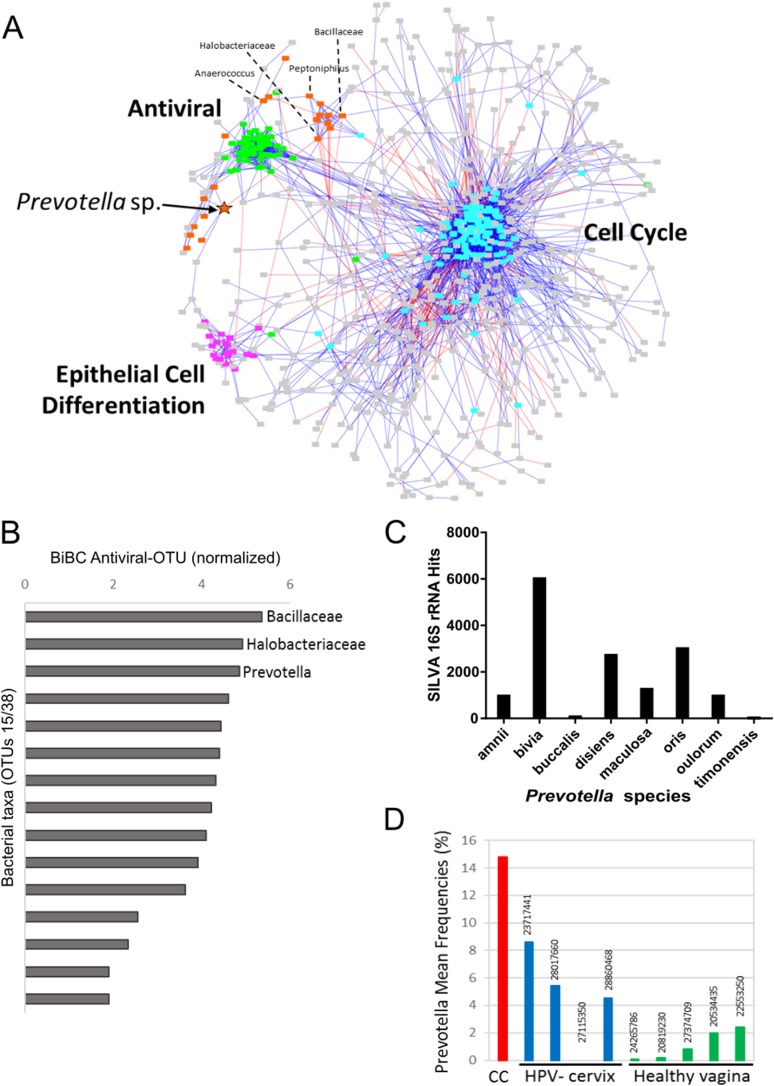
Figure 2. Transkingdom microbe-gene regulatory network.
(A) Transkingdom correlation network (p < 0.001; FDR < 0.1) between microbial network (21 OTUs, 50 edges) and previously described (Mine et al., 2013) tumor differentially expressed genes (698 DEGs, 3,066 edges) connected by 19 edges. Edge-weighted spring layout was performed in Cytoscape. Nodes represent: orange—bacteria; green—antiviral genes; purple—epithelial cell differentiation genes; blue—cell cycle genes; and gray—genes not assigned to specific subnetwork or function. Lines indicate: blue—positive of correlation between nodes; red—negative of correlation between nodes. Orange star indicates Prevotella OTU with high BiBC whereas dashed lines connecting the node and its name designate the top five BiBC scored bacteria OTU. (B) Top BiBC OTUs (15/38) calculated between microbial subnetwork and antiviral subnetwork. (C) Top Prevotella species in SILVA 16S rRNA database matched to representative sequences assigned to OTU_97.1949 (match length >200 bp, mismatch = 40 bp). (D) Prevotella mean abundance in cervical cancer (CC) compared with previous 16S studies for healthy adjacent sites: HPV negative cervix (HPV-cervix) and healthy vaginal microbiome (healthy vagina). (PMID numbers of the source article specified for each column).

