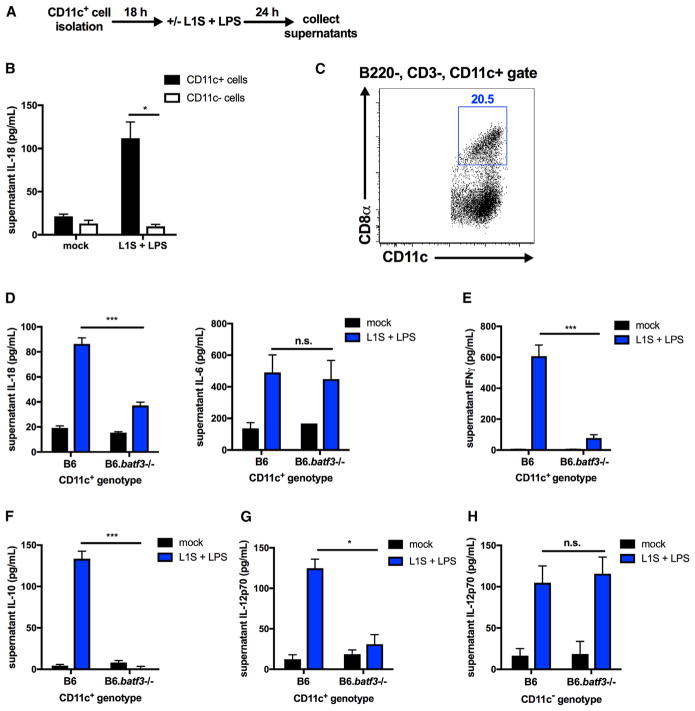
Figure 5. Batf3 Expression Licenses DC IL-18 Production in Response to L1S+LPS.
(A) Schematic of CD11c+ cell stimulation in vitro.
(B) Supernatant IL-18 detected from CD11c+/− cells 24 hr post-stimulation with L1S+LPS (n = 3 independent experiments pooled).
(C) CD8α+CD11c+ cells detected by flow cytometry from the B220−CD3−CD11c+ gate of purified CD11c+ cells (representative of n = 3 experiments).
(D) Supernatant IL-18 (left) and IL-6 (right) detected in CD11c+ cells purified from B6 or B6.Batf3−/− mice 24 hr after stimulation with L1S+LPS.
(E and F) Supernatant cytokines detected following co-culture of NK cells with B6 or B6.Batf3−/− CD11c+ cells 24 hr after stimulation with L1S+LPS (IFNγ, E) or 72 hr following NK cell exposure to filtered supernatants from B6 or B6.Batf3−/− CD11c+ cells stimulated with L1S+LPS for 1 hr (IL-10, F).
(G and H) Supernatant IL-12p70 detected 24 hr after stimulation of B6 or B6.Batf3−/− CD11c+ (G) or CD11c− (H) cells with L1S+LPS (n = 3 independent experiments pooled for in vitro experiments).
Data are displayed as mean ± SEM; *p < 0.05 and ***p < 0.001 as measured by t test.

