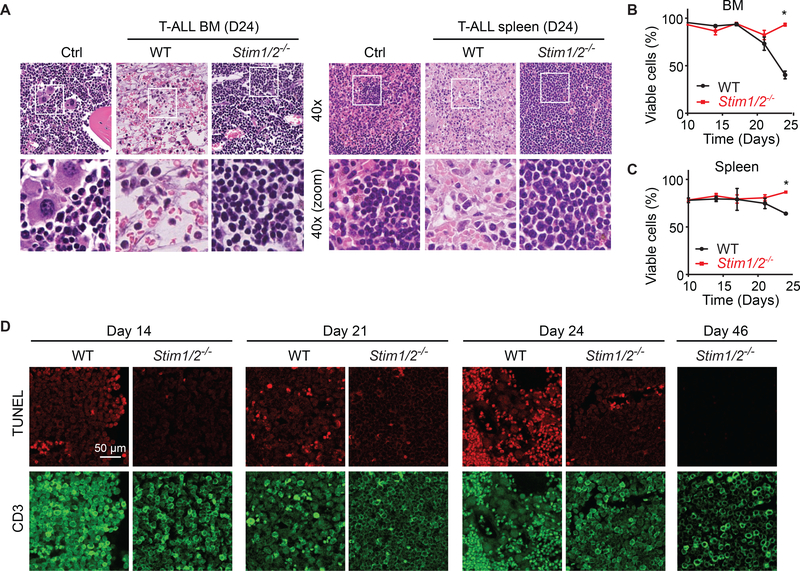
Figure 3. STIM1/STIM2-Deficient Leukemic Cells Fail to Cause Cell Death and Necrosis of Leukemia-Infiltrated Organs.
(A) H&E staining of BM (femur) and spleen from healthy WT control mice (Ctrl) and mice with WT and Stim1/2−/− leukemia 24 days after T-ALL induction Magnification 4003; images in bottom row represent boxed areas in top row. Images are representative of 3–5 mice per group.
(B and C) Viability of cells isolated from the BM (B) and spleen (C) of mice with WT and Stim1/2−/− leukemia measured by flow cytometry. Data are representative of 3–5 mice per cohort.
(D) Fluorescent confocal microscopy images of TUNEL staining and CD3 expression in the BM of mice with WT and Stim1/2−/− leukemia. Scale bar, 50 μm. Data are representative of three mice per group and time point.

