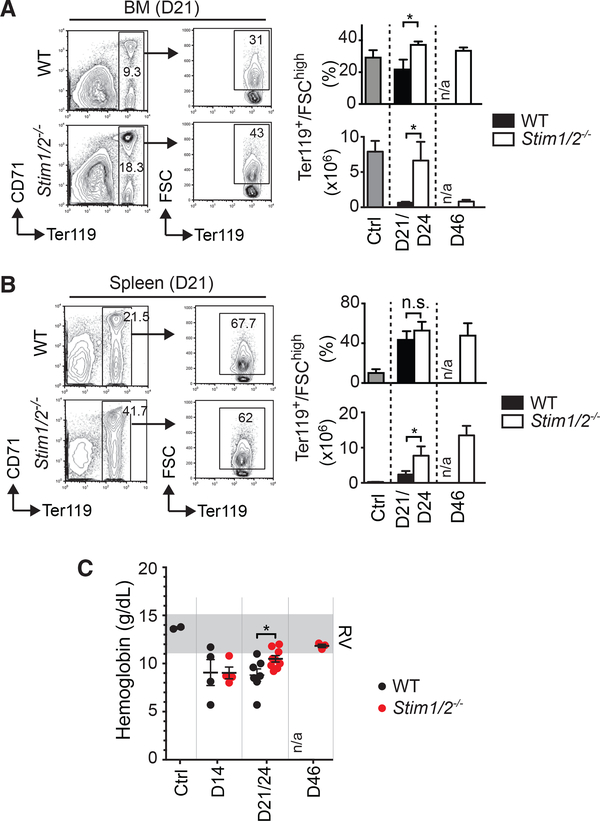
Figure 4. Lack of STIM1 and STIM2 in Leukemic T Lymphoblasts Protects Mice from Anemia.
(A and B) Representative flow cytometry plots of erythropoietic precursor cells in the BM (A) and spleen (B) of mice with WT and Stim1/2−/− leukemia at day 21 of disease. Bar graphs show percentages and absolute numbers of Ter119+ forward scatter (FSC) high erythropoietic precursor cells in mice with WT and Stim1/2−/− leukemia as well as healthy WT control mice (ctrl). Data are representative of five to eight mice per group. n/a, not applicable (no cells available for analysis).
(C) Hemoglobin levels in the blood of healthy WT control mice (ctrl) and mice with WT and Stim1/2−/− leukemia. RV, range of reference values. Each dot represents a single mouse.
Cell numbers (A and B) and Hb levels (C) at days 21 and 24 of disease (D21/ D24) were combined. All values represented by bar graphs (A and B) and dot plots (C) are mean ± SEM. Statistical analysis was performed using Student’s t test. *p < 0.05.

