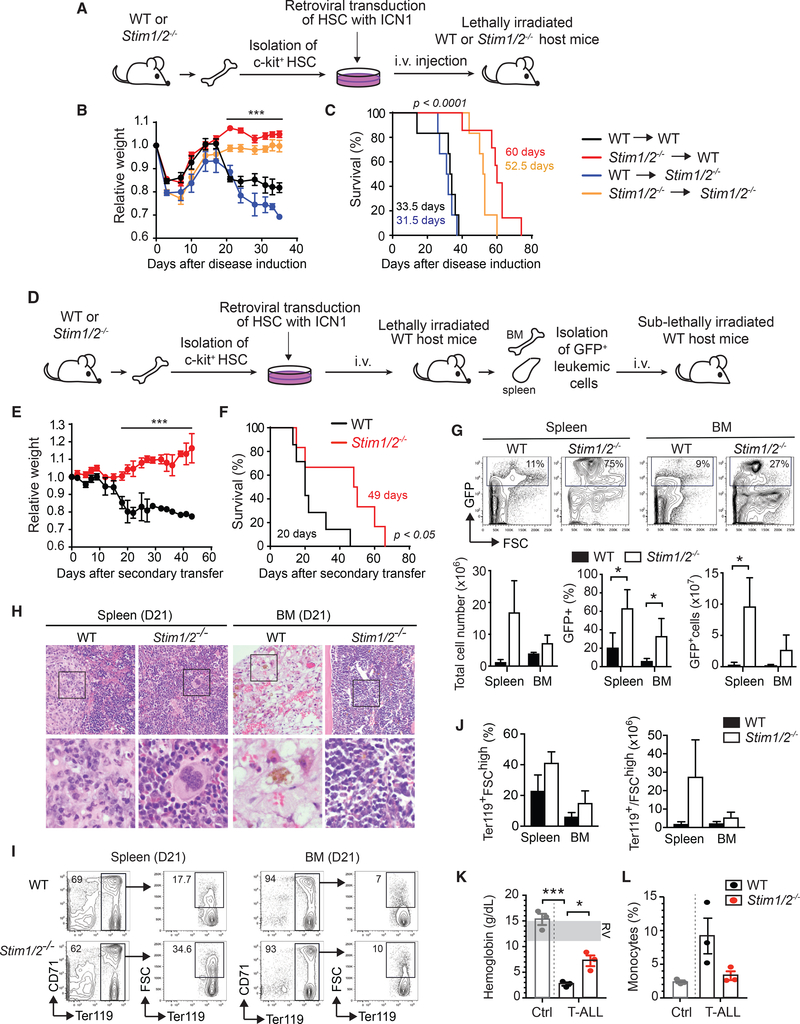
Figure 6. STIM1 and STIM2 in Leukemic T Lymphoblasts Promote Inflammation, Anemia, and Leukemia-Associated Mortality.
(A) BM cells from WT or Stim1fl/flStim2fl/flVav-Cre (Stim1/2−/−) mice were transduced with ICN1-IRES-GFP and cultured for 3 days in vitro. 5 × 10⁴ ICN1transduced (GFP+) lineage negative (lin–) BM progenitor cells were injected i.v. together with 5 × 10⁵ BM cells from WT or Stim1/2−/− mice into lethally irradiated WT or Stim1/2−/− host mice.
(B) Relative weight of mice during disease progression. Values are mean ± SEM. Statistical analysis was performed using one-way ANOVA. ***p < 0.0001.
(C) Survival of mice with T-ALL. Statistical significance was calculated using the non-parametric Kaplan-Meier estimator. Data in (B) and (C) are from6–7 mice per cohort.
(D–K) Secondary transfer of leukemic T lymphoblasts. T-ALL in WT mice was induced using BMprogenitor cells from WT or Stim1fl/flStim2fl/flVav-Cre (Stim1/2−/−) mice as described in (A). On day 8 following injection of ICN1+ progenitor cells, cells from the BM and spleen of mice were enriched for GFP+ leukemic T lymphoblasts. 1 × 10⁵ GFP+ cells were injected i.v. into sublethally irradiated WT host mice (D). Relative weight of mice with WT and Stim1/2−/− leukemia. Values are mean ± SEM. Statistical analysis was performed using Student’s t test. ***p < 0.0001 (E). Survival of mice with WT and Stim1/2−/− leukemia. Statistical significance was calculated with the non-parametric Kaplan-Meier estimator (F). Data in (E) and (F) are from seven mice per cohort. Representative flowcytometry plots (top) and means ± SEM (bottom) of total cell numbers as well as percentages and absolute numbers of GFP+ leukemic cells in the spleen and BM of mice at 21 days of T-ALL. Data from three mice per cohort (G). H&E stain of spleen and BM (femur) from mice with WT and Stim1/2−/− leukemia at day 21 of T-ALL. Magnification 4003; images in bottom row represent boxed areas in top row. Images are representative of three mice per cohort (H).
(I and J) Representative flow cytometry plots (I) and means ± SEM (J) of Ter119+ FSChigh erythroid progenitor cells in the spleen and BM at 21 days of disease. Percentages refer to total cells isolated from the BM and spleen. Data are representative of three mice per group.
(K and L) Hemoglobin levels (K) and percentages of monocytes (L) in the blood of healthy WT control mice (Ctrl) and mice with WT and Stim1/2−/− leukemia at 21 days of disease. Each dot represents one mouse. RV, reference values.

