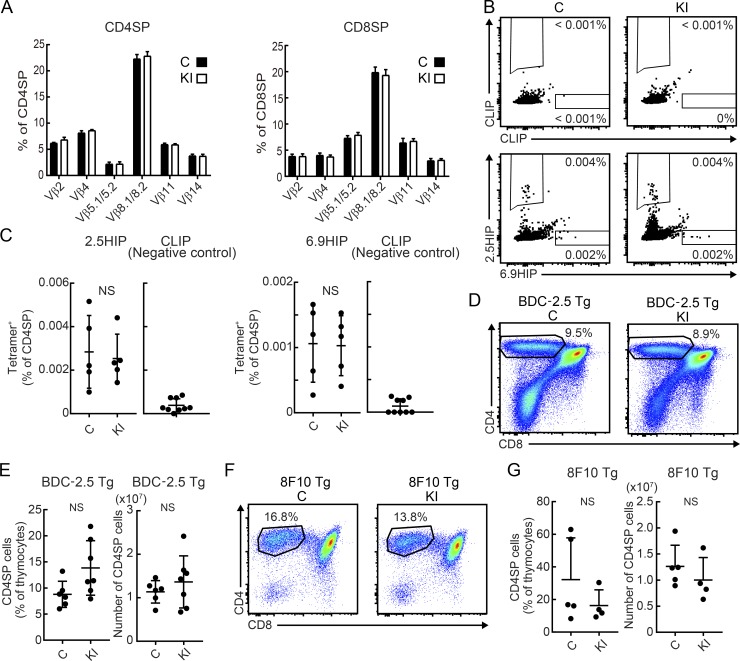
Figure 7.
Normal thymic differentiation of β cell antigen–reactive CD4+ T cells in M98A/M98A mice. (A) Percentage of thymocytes expressing particular Vβ TCR chains in CD4SP or CD8SP cells from 12-wk-old control (C) or M98A/M98A (KI) mice (n = 4 mice/group). (B and C) Flow-cytometric analysis of CD4SP T cells from the thymus of 9-wk-old control (C) or M98A/M98A (KI) mice by two-color tetramer labeling (PE and allophycocyanin) for either negative control CLIP as well as 6.9HIP and 2.5HIP peptides (n = 5 mice/group). (D and E) Representative flow-cytometric analysis of CD4SP T cells in the thymus from 3-wk-old BDC-2.5 Tg M98A/M98A (KI) or BDC-2.5 Tg control (C) mice (littermate control; (n = 6–7 mice/group). (F and G) Flow-cytometric analysis of CD4SP T cells in the thymus from 3-wk-old 8F10 Tg M98A/M98A mice (KI) or 8F10 Tg control mice (C) (littermate control; n = 4–5 mice/group). Data represent two independent experiments. Statistical analyses were performed with the Mann-Whitney test, mean ± SD (C and E) or mean + SD (A and G) are shown.

