Figure 1.
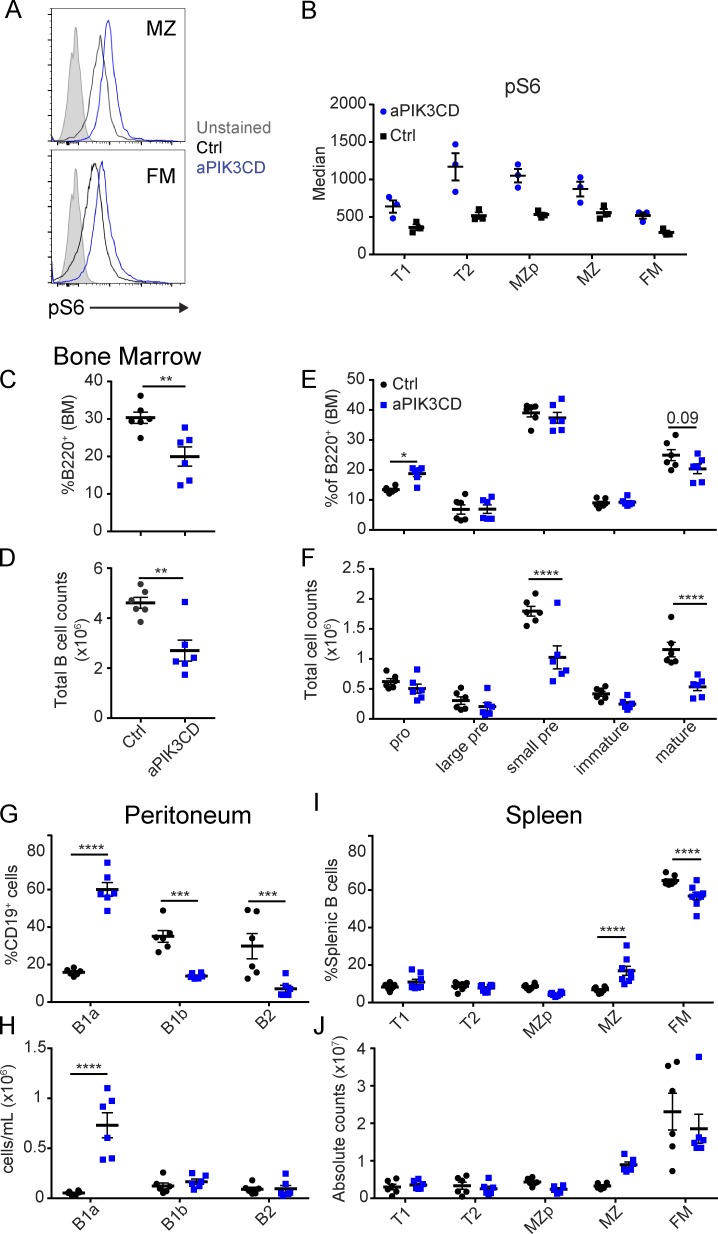
Mb1-aPIK3CD mice exhibit BM B lymphopenia and expanded peripheral, innate B cell compartments. (A) pS6 in unstimulated MZ (top) and FM (bottom) splenic B cells. Filled gray histogram: unstained control; open histograms: black, control, and blue, Mb1-aPIK3CD. (B) Median fluorescent intensity of pS6 in splenic B cell subsets in Mb1-aPIK3CD and control mice. Data shown are representative of one of two independent experiments with six controls and six Mb1-aPIK3CD mice. (C and D) Frequency (P = 0.006; C) and absolute cell counts (D) of BM B cells (B220+, P = 0.002) in littermate control (Ctrl) and Mb1-aPIK3CD mice. Significance calculated by Student’s unpaired t test. (E and F) Frequency (pro–B cells, P = 0.03; E) and absolute cell counts (F) of BM B cell subsets (as defined in Fig. S1 E; small pre P, < 0.0001; mature P, < 0.0001). (G and H) Frequency (B1a, P < 0.0001; B1b, P = 0.0005; and B2, P = 0.0002; G) and absolute number (H) of peritoneal B cell subsets per milliliter of peritoneal fluid collected (as defined in Fig. S1 F; B1a, P < 0.0001). (I and J) Frequency (MZ and FM, P < 0.0001; I) and absolute number (J) of splenic B cell subsets (as defined in Fig. S1 G). (C–J) Black: control mice—animals expressing WT Pik3cd. Blue: aPIK3CD mice—mice expressing one copy of Pik3cd-E1020K (hE1021K) restricted to B cell lineage. (E–J) Significance calculated by two-way ANOVA. (C–H) Data representative of two independent experiments with six controls and six aPIK3CD mice all ∼12 wk of age. (I and J) Data representative of three independent experiments with six controls and eight aPIK3CD mice all ∼12 wk of age. *, P < 0.05; **, P < 0.01; ***, P < 0.001; ****, P < 0.0001. For summary graphs, lines indicate mean ± SEM.

