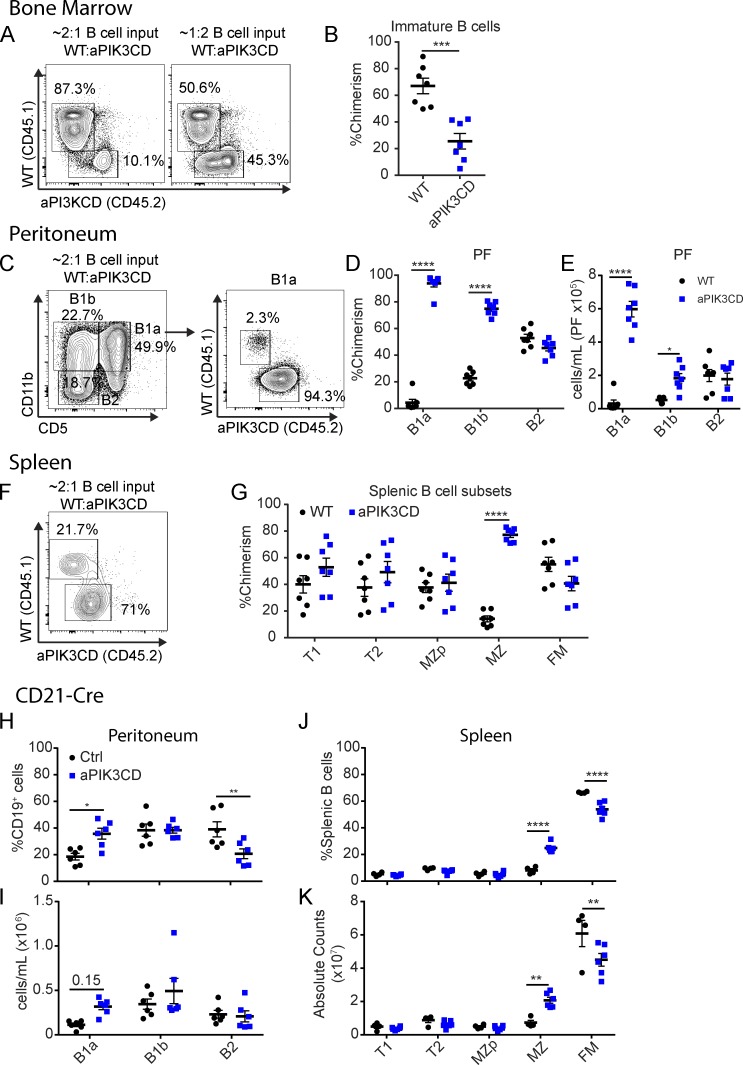
Figure 2.
aPIK3CD B cells exhibit a competitive disadvantage in the BM but outcompete WT B cells in innate B cell compartments. (A–G) WT (CD45.1+) and Mb1-aPIK3CD (CD45.2+) total BM was adoptively transferred into preconditioned (CD45.1+/CD45.2+) µMT recipient animals. Recipient animals were sacrificed 12 wk after transfer. (A) Representative flow plots of BM B cell chimerism at 12 wk after transfer with left panel showing experiment using 2:1 ratio of WT to Mb1-aPIK3CD input BM B cells and right panel showing 1:2 ratio of WT to Mb1-aPIK3CD input BM B cells. (B) Immature BM B cell chimerism (P = 0.0003). Significance calculated by Student’s unpaired t test. (C) Representative flow plots of peritoneal B cell subsets (left panel) and B1a B cell chimerism (right panel) at 12 wk after transfer of 2:1 ratio of WT to Mb1-aPIK3CD input BM B cells. (D) Chimerism of peritoneal B cell subsets (B1a and B1b, P < 0.0001). (E) Absolute number of peritoneal B cells derived from Mb1-aPIK3CD and WT donor BM (B1a, P < 0.0001; B1b, P = 0.02). (F) Representative flow plots of splenic MZ B cell chimerism at 12 wk after transfer of 2:1 ratio of WT to Mb1-aPIK3CD input BM B cells. (G) Chimerism of splenic B cell subsets (MZ, P < 0.0001). (H–K) aPIK3CD carrier animals were crossed to the CD21-Cre strain and characterized at ∼12 wk of age. (H and I) Frequency (B1a, P = 0.01; B2, P = 0.008; H) and absolute numbers (I) of peritoneal B cell subsets per milliliter of peritoneal fluid collected. (J and K) Frequency (MZ and FM, P < 0.0001; J) and absolute numbers (K) of splenic B cell subsets (MZ, P = 0.005; FM, P = 0.0008). (D, E, and G–K) Significance calculated by two-way ANOVA. (A and B) Data representative of two independent experiments with seven recipients with input BM ratio as shown in A. (C–G) Data representative of two independent experiments with seven recipients with 2:1 ratio of WT to Mb1-aPIK3CD input BM B cells. (H–K) Data representative of two independent experiments with six controls and six CD21-aPIK3CD mice, 10–12 wk of age. *, P < 0.05; **, P < 0.01; ***, P < 0.001; ****, P < 0.0001. For summary graphs, lines indicate mean ± SEM.

