Figure 3.
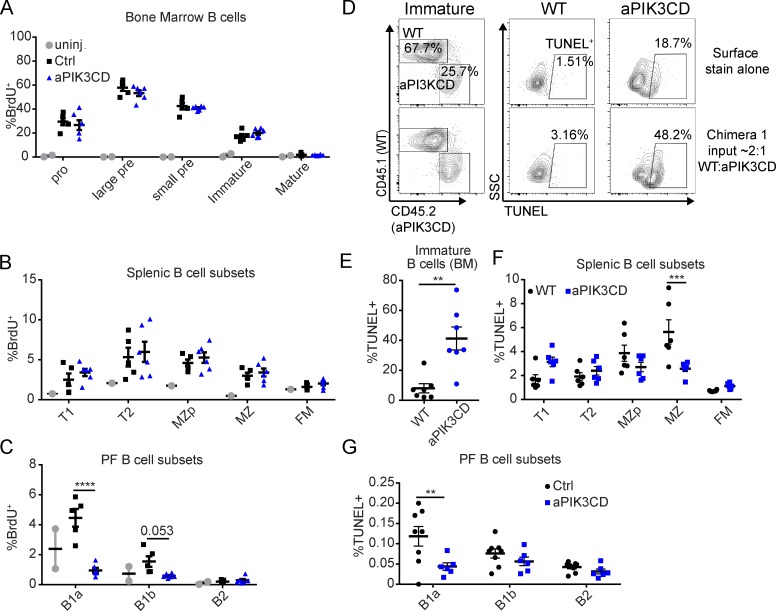
aPIK3CD does not alter B cell cycling but differentially impacts survival in immature versus innate B cell subsets. (A–C) Mb1-aPIK3CD and control mice were injected with 1 mg BrdU i.p. 24 h before sacrifice. Percent BrdU+ cells in BM B cell subsets (A), percent BrdU+ cells in splenic B cell subsets (B), and percent BrdU+ cells in peritoneal B cell subsets (C) in Mb1-aPIK3CD and control mice (B1a, P < 0.0001). Data representative of two independent experiments with six controls and six Mb1-aPIK3CD mice injected with BrdU and two BrdU–uninjected control mice (12–30 wk of age); significance calculated by two-way ANOVA. (D) Representative flow plots from competitive chimera animals assessing cell survival in immature BM B cells. Plots shown depict the following: left panels, the relative frequency of WT (CD45.1) versus Mb1-aPIK3CD (CD45.2) immature BM B cells (B220+IgM+IgD−); bottom, middle, and right panels, the frequency of apoptotic cells (TUNEL+) within WT versus Mb1-aPIK3CD immature B cells, respectively; and top, middle, and right panels, WT versus Mb1-aPIK3CD immature B cells, respectively, not subjected to TUNEL staining shown as a negative control. (E) Percent TUNEL+ WT versus Mb1-aPIK3CD BM immature B cells in µMT recipient animals (P = 0.002, 12 wk after transfer with 2:1 and 1:2 ratio of WT to Mb1-aPIK3CD input BM B cells; see Fig. 2 A). Significance calculated by Student’s unpaired t test. Data representative of two independent experiments with seven recipients with input BM ratio as shown in Fig. 2 A. (F) Percent TUNEL+ WT versus Mb1-aPIK3CD splenic B cell subsets in µMT recipient animals (MZ, P = 0.0002, 12 wk after transfer with same input as in D). Data representative of two independent experiments with seven recipients with 2:1 ratio of WT to Mb1-aPIK3CD input BM B cells. (G) Percent TUNEL+ cells in peritoneal B cell subsets in CD21-aPIK3CD and control mice (B1a, P = 0.002, eight control and six CD21-aPIK3CD mice, 12–19 wk of age). (F and G) Significance calculated by two-way ANOVA. **, P < 0.01; ***, P < 0.001; ****, P < 0.0001. For summary graphs, lines indicate mean ± SEM.

