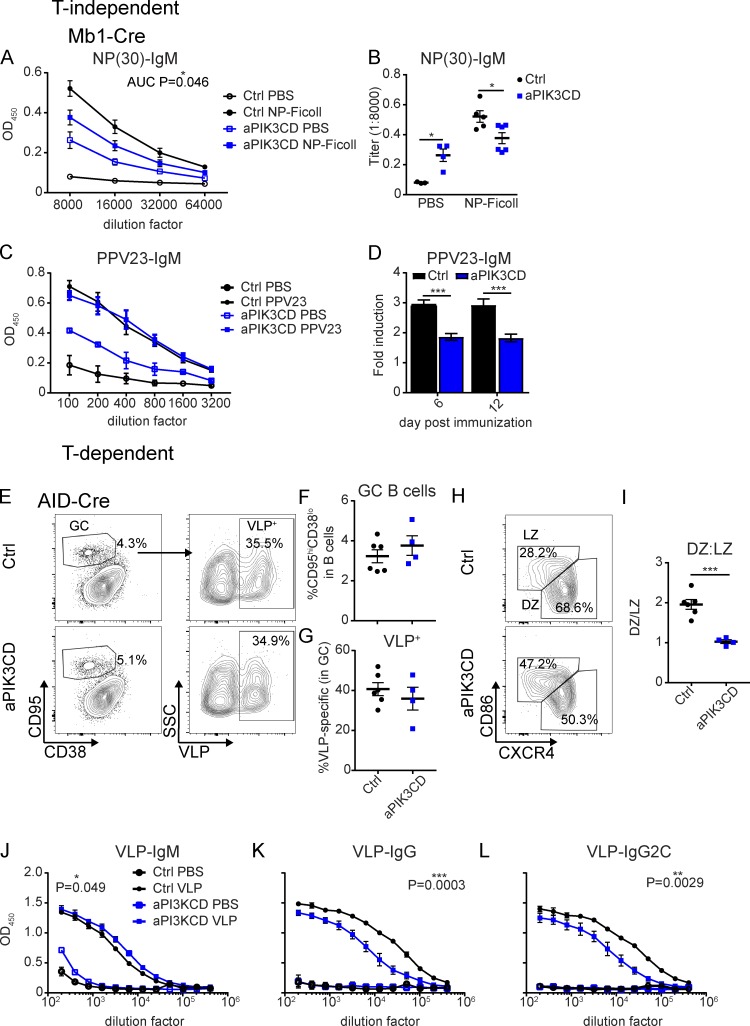
Figure 5.
B cell–intrinsic aPIK3CD expression limits both TI and TD humoral responses. (A and B) Control and Mb1-aPIK3CD mice were injected i.p. with 50 μg NP-Ficoll or PBS and sacrificed 7 d after immunization. (A) Dilution curves of low-affinity (NP-30) antigen-specific IgM in serum at 7 d after immunization. Significance calculated by Student’s t test, testing area under the curve (AUC; P = 0.046) with baseline of 0.0415. Open black circles: control injected with PBS; filled black circles: control injected with NP-Ficoll; open blue squares: Mb1-aPIK3CD injected with PBS; filled blue squares: Mb1-aPIK3CD injected with NP-Ficoll. (B) End point titers of low-affinity (NP-30) antigen-specific IgM at 1:8,000 serum dilution (PBS, P = 0.02; and NP-Ficoll, P = 0.02). Significance calculated by Student’s t test. (A and B) Data representative of two independent experiments with three control mice injected with PBS and five injected with NP-Ficoll, and four Mb1-aPIK3CD mice injected with PBS and six injected with NP-Ficoll. (C and D) Control and Mb1-aPIK3CD mice were injected i.p. with 0.125 μg PPV23 or PBS. (C) Dilution curves of PPV23-specific IgM in serum at 6 d after immunization. Black open circles: control PBS–injected (n = 2); black filled circles: control PPV23–injected (n = 7); blue open squares: Mb1-aPIK3CD PBS–injected (n = 2); blue filled squares: Mb1-aPIK3CD PPV23–injected (n = 5). (D) Fold induction of PPV23-IgM over baseline (day 0) OD450 for days 6 and 12 after immunization with PPV23 (day 6, P = 0.0004; day 12, P = 0.0003). Black: control PPV23–injected mice; blue: Mb1-aPIK3CD PPV23–injected mice. Significance calculated by two-way ANOVA. Data representative of two independent experiments with mice 19–21 wk of age. (E–L) Control and AID-aPIK3CD mice were injected i.p. with PBS or 2 μg of VLPs containing TLR7 ligand in 250 μl and sacrificed 14 d after immunization. (E) Representative flow plots of GC B cells (B220+CD95hiCD38lo; left) and VLP-specific cells (VLP+; right) within the GC at 14 d after immunization. Top panels: control; bottom panels: AID-aPIK3CD. (F and G) Frequency of GC B cells (F) and VLP-specific cells (G) in GC at 14 d after immunization. Black: control; blue: AID-aPIK3CD. (H) Representative flow plots of DZ (CXCR4+CD86−) versus LZ (CXCR4−CD86+) GC B cells from control (top) and AID-aPIK3CD (bottom) mice at 14 d after immunization. (I) Ratio of DZ:LZ within GC in control (black) versus AID-aPIK3CD (blue) mice (P = 0.0003). Significance calculated by Student’s t test. (J and K) Dilution curves of serum VLP-specific IgM (P = 0.049; J), IgG (P = 0.0003; K), and IgG2C (P = 0.0029; L). P value calculated by Student’s t test of AUC (baseline of 0). (E–L) Data representative of two independent experiments with six control mice injected with VLPs and two injected with PBS, and four AID-aPIK3CD mice injected with VLPs and two injected with PBS at 13–16 wk of age. *, P < 0.05; **, P < 0.01; ***, P < 0.001. For summary graphs and dilution curves, lines indicate mean ± SEM. For the bar graph, error bars indicate mean + SEM.

