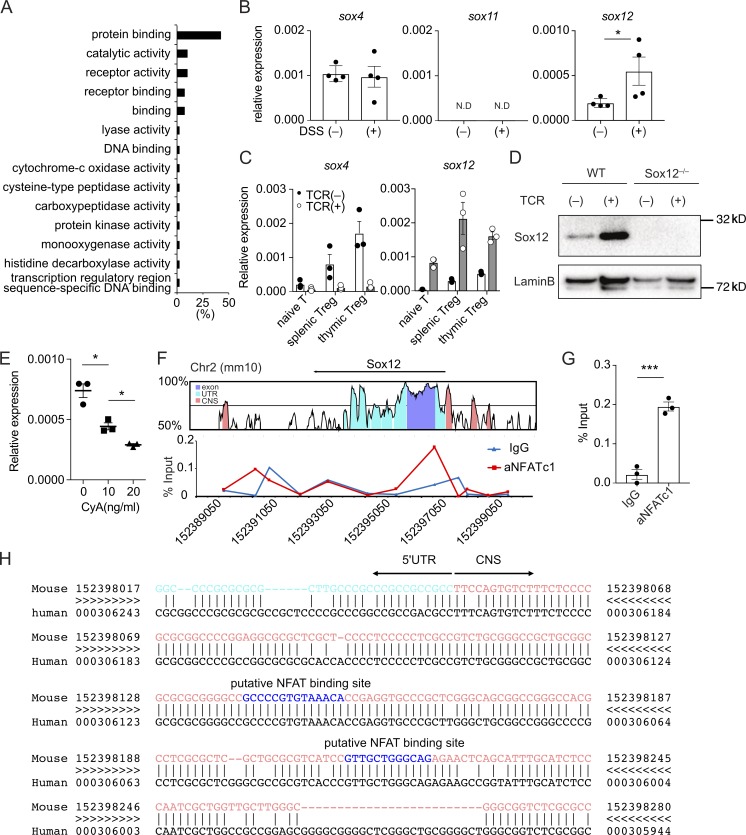
Figure 1.
T cell receptor signaling induces Sox12 expression in T reg cells. (A) Gene ontology of 56 differentially expressed transcripts in splenic T reg cells from Foxp3hCD2 mice treated with or without 3% DSS water (more than twofold). (B) Quantitative PCR analysis of SoxC family genes in splenic T reg cells in mice treated with or without DSS. Data are compiled of four independent experiments. (C) Sox4 and Sox12 expression in naive CD4+ T cells, splenic T reg cells, and thymic T reg cells cultured with or without anti-CD3ε/CD28 (TCR) stimulation for 24 h. Data are compiled from three independent experiments. (D) Nuclear proteins of WT or Sox12−/− CD4+ T cells stimulated with or without TCR for 24 h were immunoblotted with antibodies against Sox12 and LaminB1. Data are representative of three independent experiments. (E) Naive CD4+ T cells were stimulated with TCR in the presence of indicated amounts of cyclosporin A (0–20 µg/ml) for 24 h, and Sox12 expression was assessed by qPCR. Data are compiled from three independent experiments. (F and G) Naive CD4+ T cells were stimulated with TCR for 4 h. ChIP-qPCR assay for Sox12 gene locus was performed with anti-NFATc1 antibody or control mouse IgG. Shown are VISTA plot of Sox12 gene locus (GRCm38/mm10, Chr2) and representative NFATc1 binding plot to Sox12 regulatory region (F) and means ± SEM of percent input of NFATc1 or control mouse IgG binding to the promoter of Sox12 gene (G). (H) Shown are 5′UTR (light blue), upstream CNS sequences (pink), and putative NFAT binding sequences (blue) of Sox12 gene analyzed by rVISTA. (C, E, and G) *, P < 0.05; ***, P < 0.001 by unpaired t test.

