Figure 2.
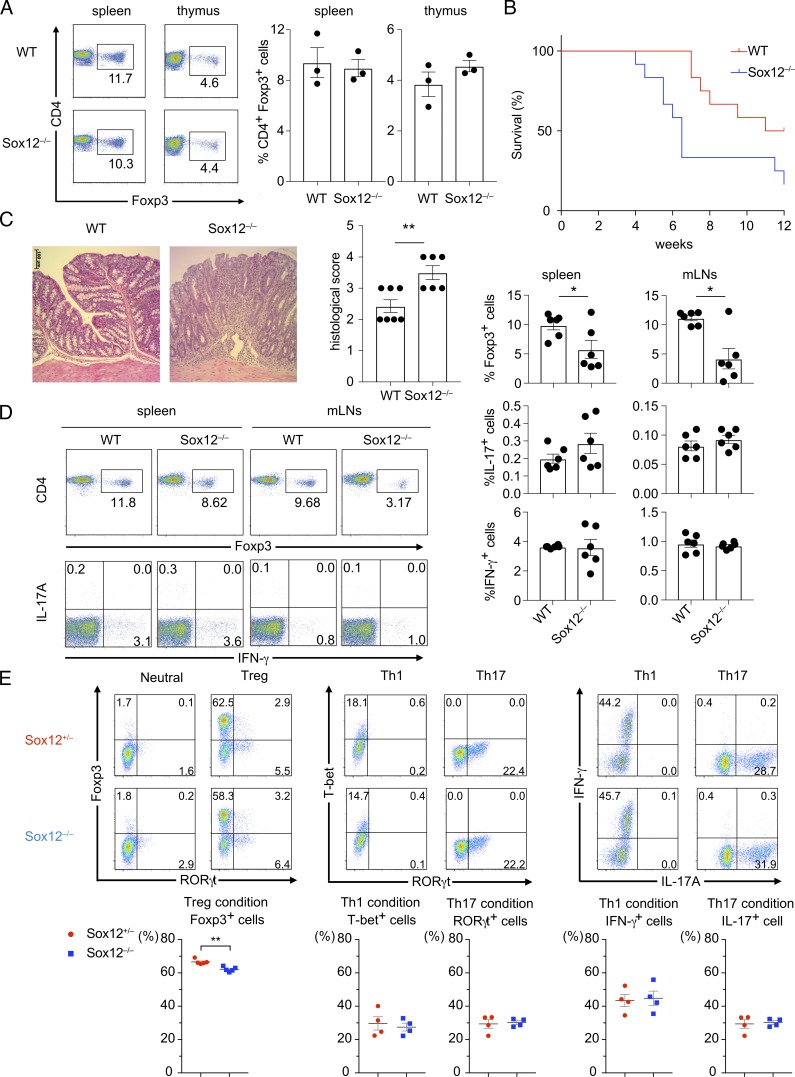
Sox12−/− naive CD4+ T cells fail to convert into pT reg cells in adoptive transfer colitis. (A) Representative FACS profiles of CD4 versus Foxp3 of CD4+ T cells harvested from spleen and thymus of WT or Sox12−/− mice are shown (left). Bar plots indicate the percent of Foxp3+ cells (right). (B–E) Naive CD4+ T cells from WT or Sox12−/− mice were transferred to RAG2−/− mice to induce adoptive transfer colitis. (B) Survival plot is depicted. Data are compiled from four independent experiments (two to three mice in each group in each experiment). (C) Shown are representative photomicrographs of H&E staining at 14 d after cell transfer (left) and means ± SEM of histopathological scores (right). Bar, 100 µm. (D) CD4+ T cells were harvested from spleen and mLNs at 14 d after cell transfer and stimulated with PMA/ionomycin for 4 h. Shown are representative FACS profiles of CD4 versus Foxp3 and IFN-γ versus IL-17A and means ± SEM of the percentages of the indicated cells. Data are compiled from three independent experiments (six mice in each group). (E) Naive CD4+ T cells from Sox12−/− mice and littermate Sox12+/− mice were stimulated under neutral, iT reg, Th1, and Th17 conditions. Representative FACS profiles of indicated transcription factors and cytokines (upper panels) and means ± SEM of the percentages of the indicated cells are shown. Data are compiled from four independent experiments (n = 4 or 5). (C, D, and E) *, P < 0.05; **, P < 0.01 by unpaired t test.

