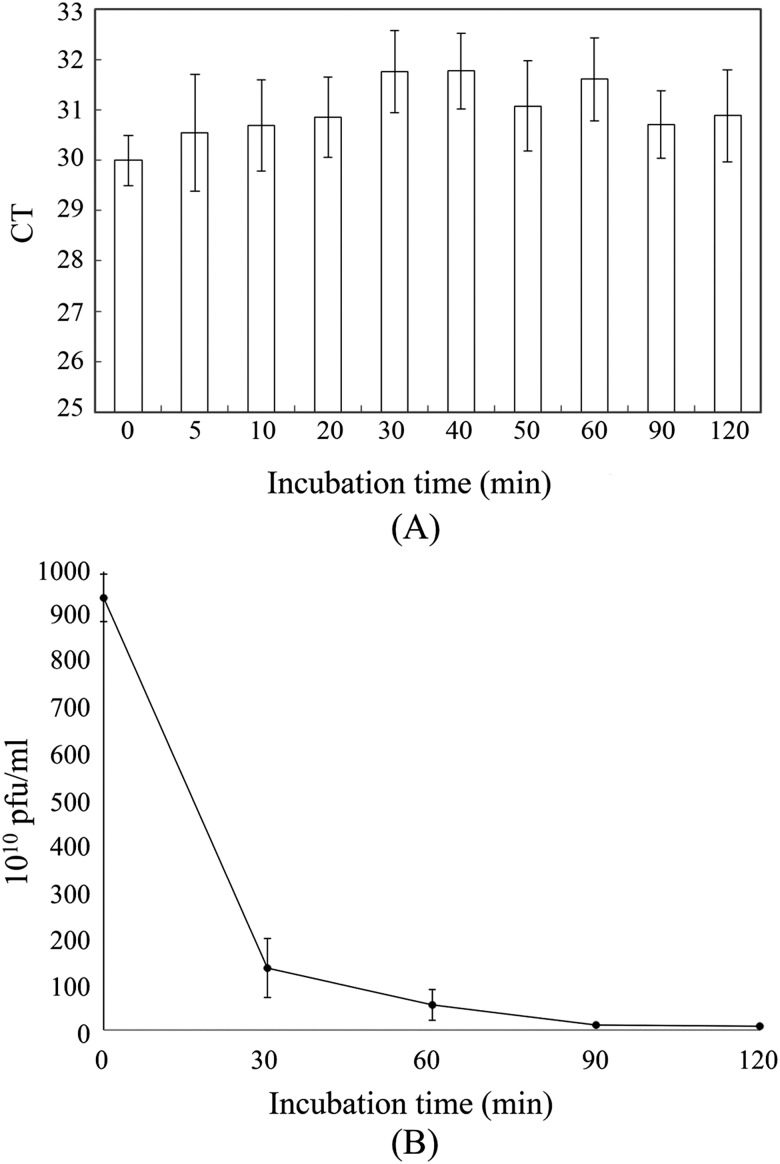
FIG. 3.
Optimization of incubation times. (a) Real-time PCR analysis of tissue-SELEX supernatants collected after varying incubation times. (b) Plaque formation assay with phage display supernatants collected at different incubation times. In panel (a), error bars represent standard deviation (N = 3). Ct = threshold cycle.

