Figure 3.

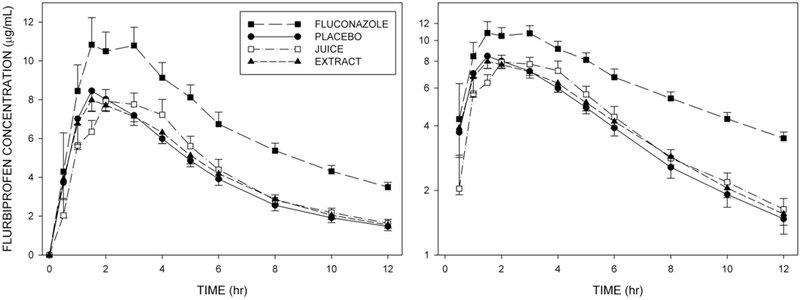
Mean (±SE, n=12) plasma flurbiprofen concentrations at corresponding times in each of the four treatment conditions. Left panel: Linear concentration axis. Right panel: Logarithmic concentration axis.

Mean (±SE, n=12) plasma flurbiprofen concentrations at corresponding times in each of the four treatment conditions. Left panel: Linear concentration axis. Right panel: Logarithmic concentration axis.