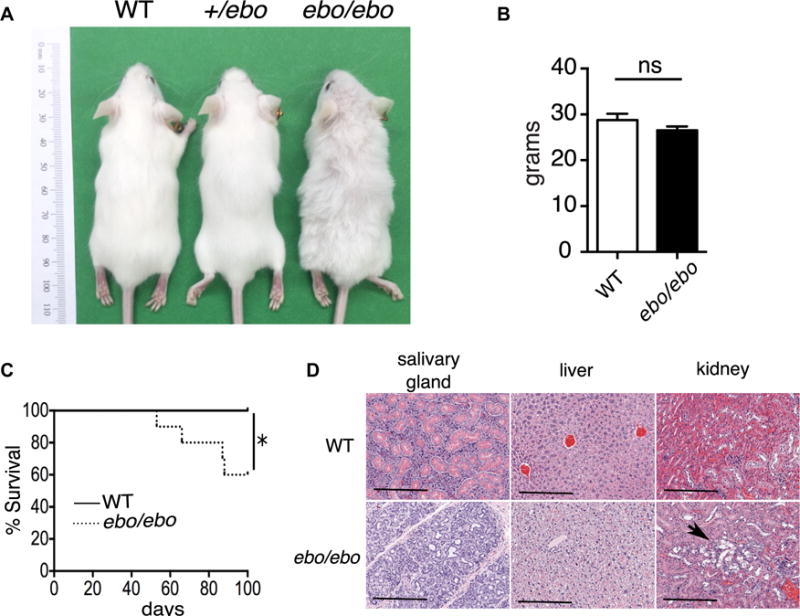
FIG 2.

Effect of the ebo mutation on mouse phenotype. A, Gross appearance at 8 weeks of age of ebo/ebo, +/ebo, and WT littermate mice. B, Weight at 11 weeks of age of ebo/ebo (n = 14) and WT (n = 15) littermate mice. C, Kaplan-Meier analysis of survival of ebo/ebo and WT littermate mice (n = 10 from each group). D, Representative hematoxylin and eosin–stained tissue sections from salivary glands, livers, and kidneys of ebo/ebo mice and WT littermates (n = 3 per group, × 10 magnification). Bars = 200 μm. Arrow shows tubular degeneration. Results in Fig 2C and D, are representative of 3 independent experiments, each with 1 mouse per strain. Columns and bars represent means and SEM. ns, Not significant. *P < .05, log-rank test.
