
FIG 3.
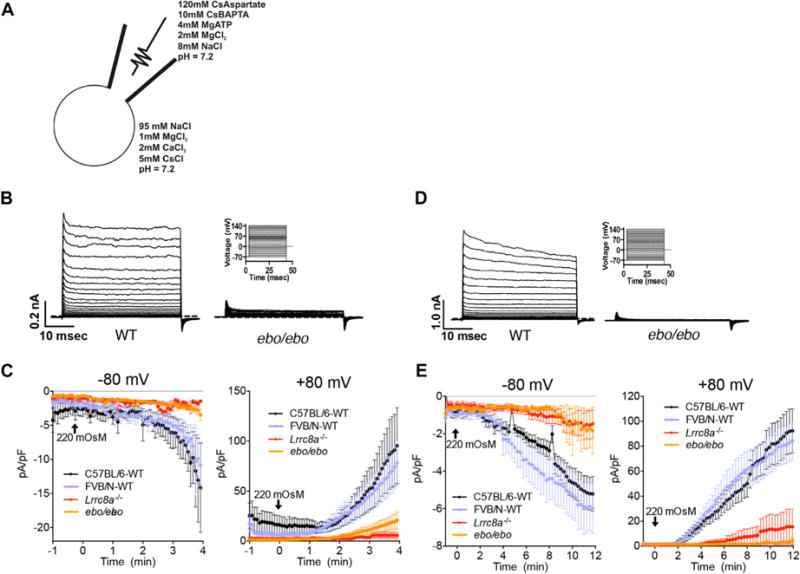
ebo dramatically reduces VRAC activity. A, Solution scheme used for patch-clamp analysis. B and D, Current traces induced in splenic T cells (Fig 3B) and peritoneal macrophages (Fig 3D) from WT (left panels) and ebo/ebo (right lower panels) mice by the indicated voltage step protocol shown in right upper panels. The dashed line indicates 0 current. C and E, Current densities induced in splenic T cells (Fig 3C) and peritoneal macrophages (Fig 3E) from ebo/ebo, Lrrc8a−/−, and WT control mice by using a 220 mOsm hypotonic stimulus at −80 mV (left panels) or +80 mV (right panels). Results are representative of 8 to 12 cells pooled from 3 or more independent experiments by using 1 mouse per group in each experiment.