
FIG 4.
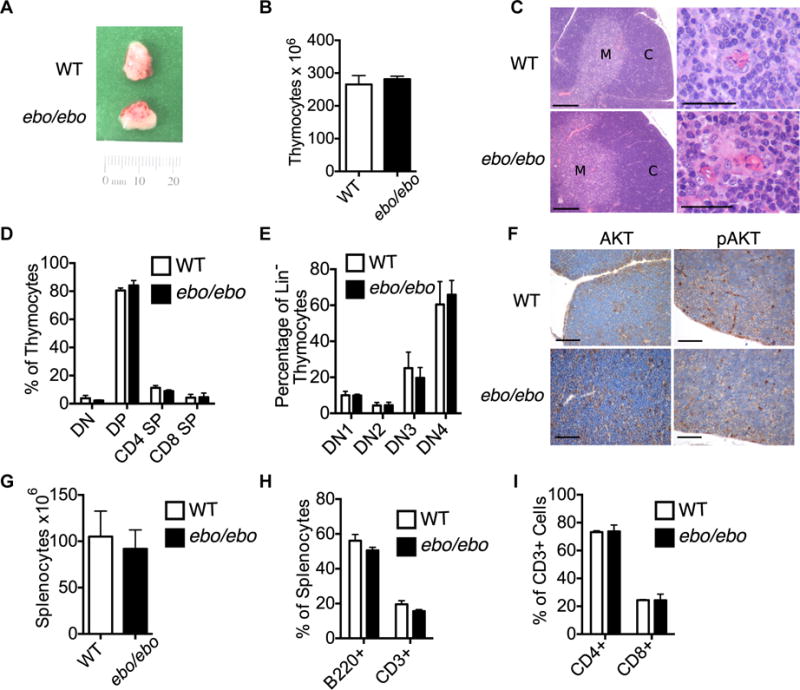
Normal T-cell development and function in ebo/ebo mice. A and B, Gross appearance of the thymus (Fig 4A) and number of thymocytes (Fig 4B) in 3-week-old WT and ebo/ebo mice. C, Hematoxylin and eosin staining of thymi from WT and ebo/ebo mice (left panels: ×10 magnification; bars, 200 μm; right panels: medullary area ×60 magnification; bars = 30 mm). C, Cortex; M, medulla. D, Percentages of DN, double-positive, and single-positive thymocytes in 3-week-old WT and ebo/ebo mice. E, Percentages of DN1, DN2, DN3, and DN4 thymocytes in WT and ebo/ebo mice. F, AKT and phospho-AKT immunohistochemistry of thymi from WT and ebo/ebo mice (×40 magnification; bars = 50 μm). G-I, Number of splenocytes (Fig 4G), percentages of CD3+ and B220+ cells (Fig 4H), and percentages of CD4+ and CD8+ cells (Fig 4I) in spleens from 11-week-old WT and ebo/ebo mice. Results in Fig 4, B, represent 4 mice per group pooled from 2 independent experiments. Results in Fig 4D and E, are of 1 representative experiment with 3 mice per group. Similar results were obtained in 2 additional experiments with 1 mouse per group. Results in Fig 4G, represent 9 mice per group pooled from 3 independent experiments. Columns and bars represent means and SEMs. Results in Fig 4H and I, represent 4 mice per group pooled from 2 independent experiments.