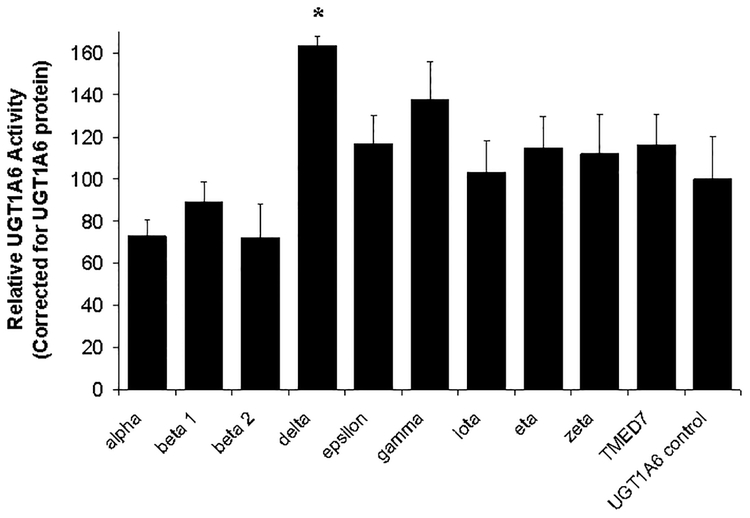
Figure 6. Effect of overexpression of nine different PKC isoforms on UGT1A6 specific activity in HEK293T cells.
The catalytic domains of nine different PKC isoforms (α, β1, β2, δ, ε, γ, ι, η, and ζ) were transiently co-expressed with UGT1A6 in HEK293T cells. Instead of PKC, some cells were cotransfected with the PKC vector control (labeled UGT1A6 control) or with a non-specific protein control (labeled TMED7). Cell lysates were prepared 48 hours post-transfection and assayed for serotonin glucuronidation. Serotonin glucuronidation activities were standardized to UGT1A6 protein (shown in Figure 5) and reported as a percentage of UGT1A6 control (without PKC) activity. Data points correspond to the mean ± standard error of three independent experiments performed on separate days. Statistical comparisons were made using one-way ANOVA followed by a Dunnett’s post hoc test. * indicates that UGT1A6 specific activity is significantly different from the UGT1A6 control value.

