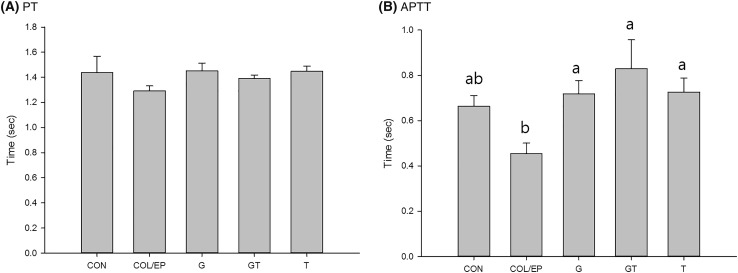
Fig. 1.
Change of (A) PT and (B) APTT when thrombosis-induced rats were administered G, T, and GT. Values are presented as mean ± SE (n = 8). Significance was analyzed by one-way ANOVA followed by Duncan’s multiple range test. Values having different superscript alphabets differ significantly at p < 0.05. PT, prothrombin time; APTT, activated partial thromboplastin time; G, garlic powder; T, tomato extract; GT, the mixture of garlic powder and tomato extract

