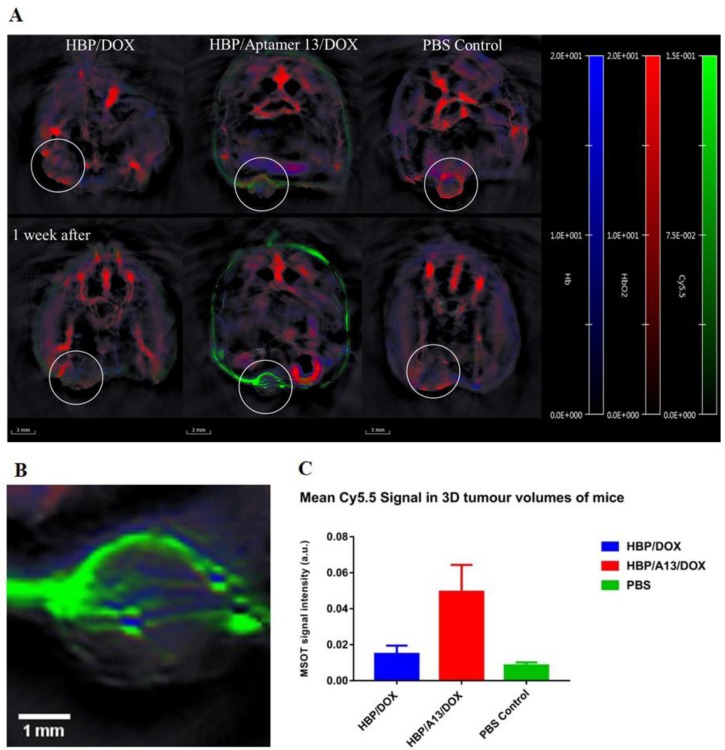
Figure 5.
(A) Representative in vivo transverse MSOT images of mice at the largest cross-section point of each tumour (circled in white) in mice treated with HBP/DOX, HBP/A13/DOX and PBS during the 3rd and 4th weeks of treatment. Spectrally unmixed MSOT signal from accumulated Cy5.5 (green, 0-0.15 a.u.) can be seen with respect to blood vessels through spectral unmixing of signal from oxygenated (red, 0-20 a.u.) and deoxygenated haemoglobin (blue, 0-20 a.u.) overlayed on a single wavelength illumination at 845 nm (greyscale). All spectra used for signal unmixing can be found in the supporting information (Figure S4) A magnification of the tumour volume of the mouse treated with targeted polymer after 4 weeks is shown in B. (C) Comparison of the mean Cy5.5 signal in each tumour volume clearly shows the highest accumulation in the targeted HBP/A13/DOX mouse. Error bars indicate the variation in signal intensity between images acquired 1 week apart in a single mouse.

