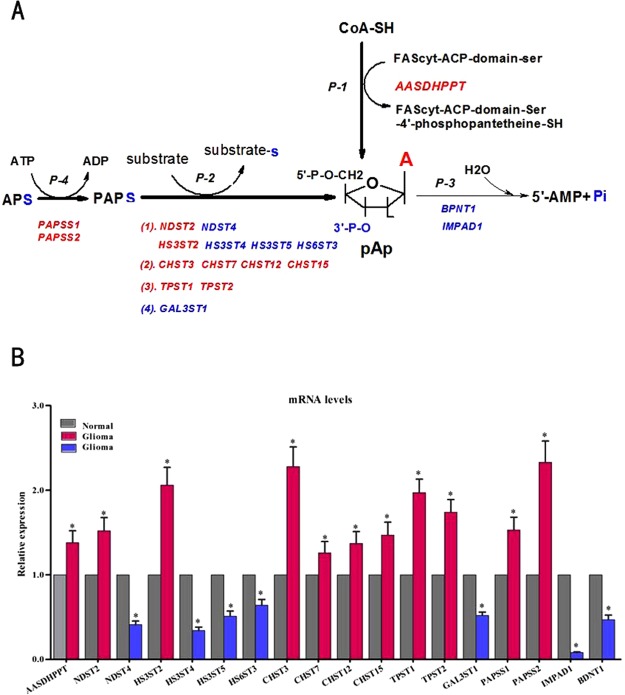
Figure 4.
The gene expression profiling of 18 enzymes associated with pAp metabolism. (A) Catalytic reaction pathways of 18 enzymes. (B) Comparison of the relative expression level of each individual enzyme gene, using GAPDH as internal control. Glioma tissues (n = 59) and control brain tissues (n = 20) of discovery set and validation set were analyzed. Bars and gene names colored red represent the up-regulated genes, while blue bars and gene names represent the down-regulated genes, gray bars represent gene expression of the paired control. *p < 0.05. (From AASDHPPT to BNDT1, the p value is 0.038, 0.032, 0.027, 0.036, 0.026, 0.019, 0.042, 0.018, 0.037, 0.032, 0.028, 0.017, 0.019, 0.034, 0.041, 0.015, 0.0067, 0.034; the fold change Mean ± SD is 1.38 ± 0.113, 1.52 ± 0.123, 0.41 ± 0.032, 2.06 ± 0.176, 0.34 ± 0.020, 0.51 ± 0.032, 0.64 ± 0.027, 2.28 ± 0.182, 1.26 ± 0.098, 1.37 ± 0.126, 1.47 ± 0.116, 1.97 ± 0.143, 1.74 ± 0.126, 0.52 ± 0.043, 1.53 ± 0.122, 2.33 ± 0.203, 0.08 ± 0.003, 0.47 ± 0.023, respectively). Abbreviation: FAScyt: cytosolic fatty acid syntha, other abbreviations refer to Table 3. Catalytic pathways of 18 enzymes: 1. P-1: activation pathway of FACcyt in fatty acid synthesis, P-2: sulphonation reaction pathway, P-3: pAp hydrolysis pathway and P-4: PAPS synthesis pathway. 2. Human genome encodes one phosphopantetheine transferase (AASDHPPT), two 3′-nucleotidases (IMPAD1 and BPNT-1), two PAPS synthase (PAPSS1 and PAPSS2) and a number of sulfotransferases (SULT). A total of 13 sulfotransferases divided into 4 types according to substrates and products of enzymes. Refer to Table 3.

