Figure 1.
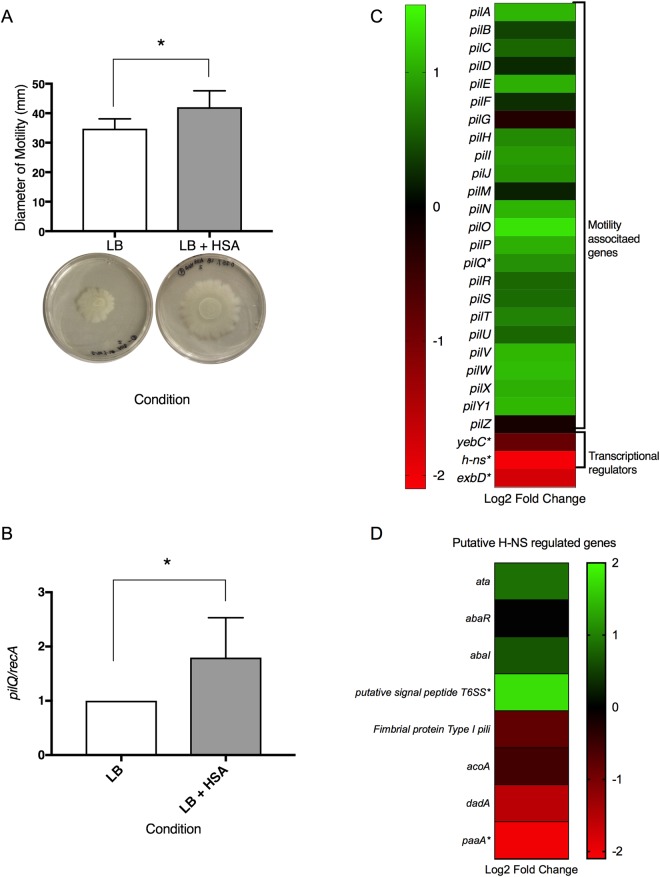
Phenotypic and genetic analysis of surface associated motility genes. (A) Motility assays resulted in a significant increase (P-value < 0.05) in the diameter of motility (mm) when grown in the presence of HSA. Cells grown with HSA had an average increase in diameter of motility of 7.28 mm. Experiments were performed in triplicate, with at least three technical replicates per biological replicate. Statistical analysis (Mann-Whitney test) was performed using GraphPad Prism (GraphPad software, San Diego, CA, USA), and a P-value < 0.05 was considered significant. (B) Quantitative PCR was performed to confirm the differential expression of pilQ. Results showed an increase in the expression of pilQ of 1.795-fold (P-value 0.0286). Experiments were performed in triplicate, with four technical replicates per biological replicate. Statistical analysis (Mann-Whitney test) was performed using GraphPad Prism (GraphPad software, San Diego, CA, USA), and a P-value < 0.05 was considered significant. (C) A heatmap outlining the differential expression of 30 genes associated with motility shows that the majority of motility associated genes are up regulated (green) while the three associated transcriptional regulators are down regulated (red). (D) A heatmap outlining the putative H-NS regulated genes shows variation in the differential expression of these genes.

