Figure 2.
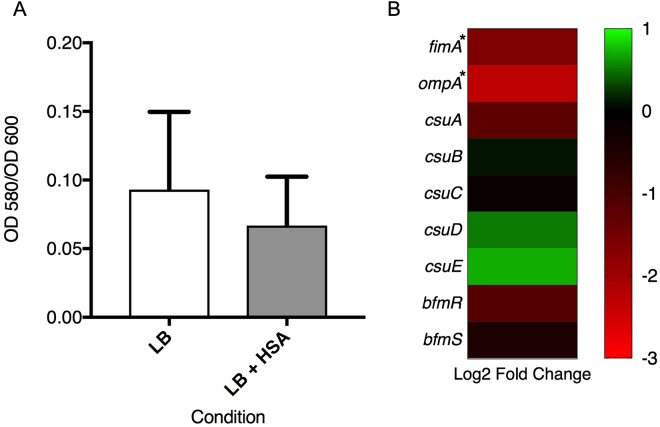
Phenotypic and genetic analysis of biofilm formation associated genes. (A) Biofilm assays performed with and without HSA show a decrease in biofilm formation (1.4-fold decrease), as represented by OD580/OD600, when grown in the presence of HSA. Experiments were performed in triplicate, with at least three technical replicates per biological replicate. Statistical analysis (Mann-Whitney test) was performed using GraphPad Prism (GraphPad software, San Diego, CA, USA), and a P-value < 0.05 was considered significant. (B) The associated heatmap outlines the differential expression of 9 genes associated with biofilm formation, including fimA, ompA, the csu operon and its regulator bfmRS.

