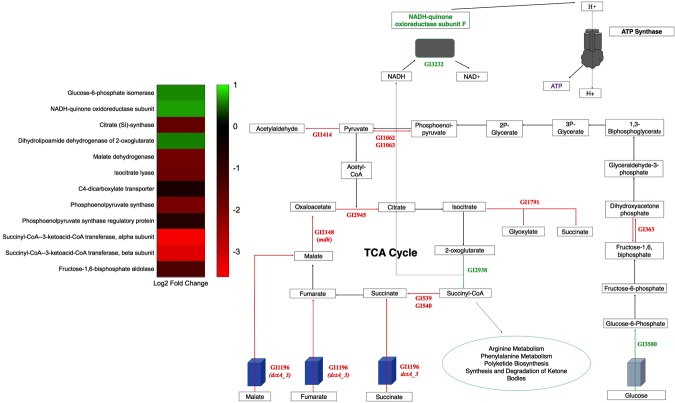
Figure 6.
Central carbon metabolism schematic. Genes involved in central carbon metabolism that were statistically differentially expressed under HSA treatment. Words or arrows in red represent statistically significant genes that were down regulated. Words or arrows in green represent statistically significant genes that were up regulated. A heatmap of central carbon metabolism statistically differentially expressed genes is also shown.

