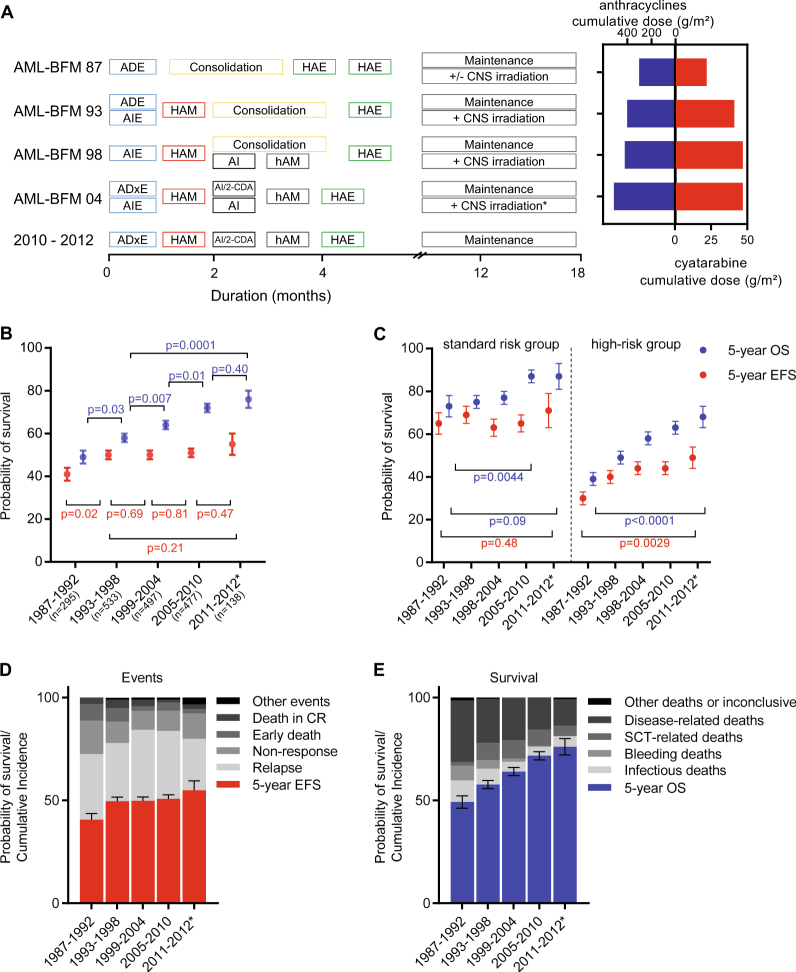
Fig. 1.
Development of overall and event-free survival from 1987–2012. a Protocol flow chart for pediatric patients with AML in AML-BFM trials from 87 until 2012. Consolidation: 6-week therapy consisting of seven different drugs: 6-thioguanine (60 mg/m2 per day, days 1–43 orally); prednisone (40 mg/m2 per day, days 1–28 orally); vincristine (1.5 mg/m2 per day, days 1, 8, 15, 22); cytarabine (75 mg/m2 per day, days 3–6, 10–13, 17–20, 24–27, 31–34, 38–41); doxorubicin (30 mg/m2 per day (AML-BFM 87 and 93)) or idarubicin (7 mg/m2 per day [AML-BFM 98], days 1, 8, 15, 22); intrathecal (age-dependent dose) cytarabine (days 1, 15, 29, 43); cyclophosphamide (500 mg/m2 per day, days 29, 43). *CNS irradiation was stopped in May 2009. Cumulative dosages of anthracycline (mg/m2) and cytarabine (g/m2) in AML-BFM trials are shown as maximal dosage given in each study. Cumulative doses were calculated as equivalent doses to daunorubicin using a ratio of 1:5 for idarubicin and mitoxantrone. ADE cytarabine (100 mg/m2), daunorubicin (60 mg/m2), etoposide (150 mg/m2), AIE cytarabine (100 mg/m2), idarubicin (12 mg/m2), etoposide (150 mg/m2), HAM high-dose cytarabine (3 g/m2), mitoxantrone (10 mg/m2), AI cytarabine (500 mg/m2), idarubicin (7 mg/m2), hAM intermediate-dose cytarabine (1 g/m2), mitoxantrone (10 mg/m2), HAE high-dose cytarabine (3 g/m2), etoposide (125 mg/m2), ADxE cytarabine (100 mg/m2), liposomal daunorubicin (80 mg/m2), etoposide (150 mg/m2), 2-CDA 2-chloro-2-deoxyadenosine (6 mg/m2), CNS central nervous system. b Development of survival per 6-year periods. Data shown as probability of EFS and OS ± SE. Kaplan–Meier curves of EFS and OS of distinct subgroups were compared using the log-rank test, shown as p value. c Development of survival per 6-year periods in patients with standard risk group [FAB M1/2 with Auer rods, FAB M4 with atypical eosinophils (M4Eo) and/or favorable cytogenetics, such as t(8;21) and/or AML1-ETO and inv(16) or t(16;16) and/or CBFB/MYH1, if there was no persistence of BM blasts (≥5%) on day 15, respectively), compared to all other patients (high-risk group). Data shown as probability of EFS and OS ± SE. Kaplan–Meier curves of EFS and OS of distinct subgroups were compared using the log-rank test, shown as p value. Standard risk: n = 88 (1987–1992); n = 174 (1993–1998); n = 151 (1999–2004); n = 148 (2005–2010); n = 39 (2011–2012). High-risk: n = 207 (1987–1992); n = 359 (1993–1998); n = 346 (1999–2004); n = 329 (2005–2010); n = 98 (2011–2012). d Overview of events (early death, death in CR, non-response, relapse, others) per 6-year periods. Data shown as probability of EFS ± SE and cumulative incidences of events. e Overview of survival and causes of deaths (caused by bleeding, infections or HSCT-related, disease-related deaths or others). Bleeding and infections have been evaluated in patients during initial disease and salvage treatment. Data shown as probability of OS ± SE and cumulative incidences of deaths. *Shorter interval for sufficient follow-up. n = 295 (1987–1992); n = 533 (1993–1998); n = 497 (1999–2004); n = 477 (2005–2010); n = 138 (2011–2012)

