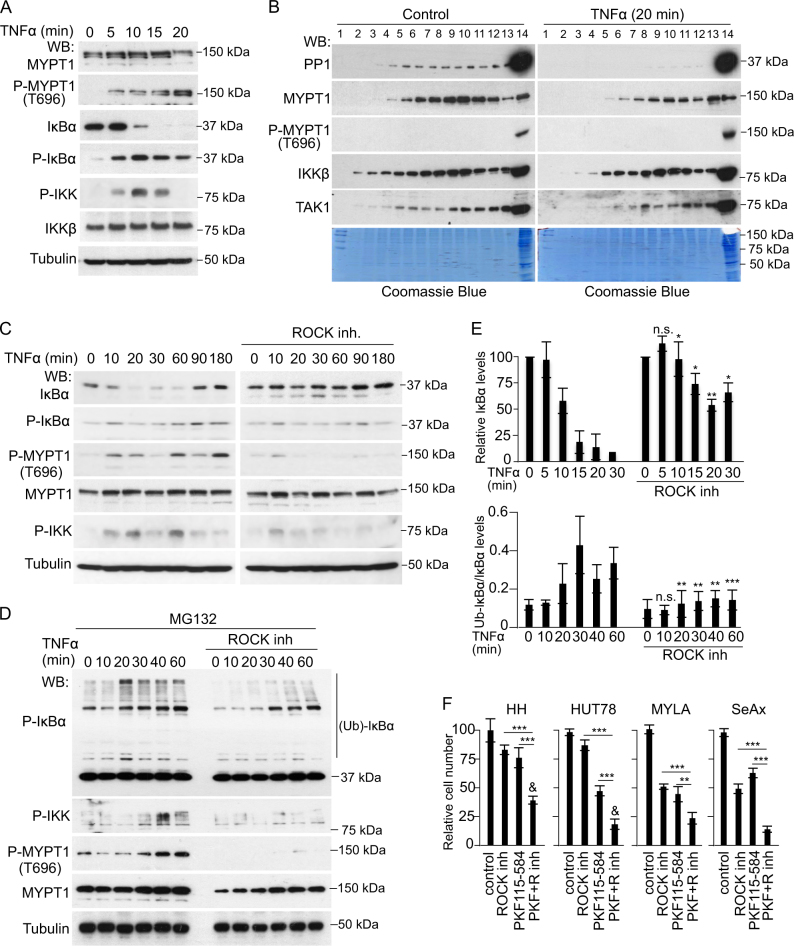
Fig. 2.
Regulation of canonical NF-κB by PP1 in CTCL cells lays downstream of the ROCK/MYPT1 pathway. a WB analysis of total cell lysates from TNFα-treated MYLA cells at the indicated time points. b WB of untreated or TNFα-treated MYLA cell lysates separated in Superdex S200 columns. c WB analysis of MYLA cells treated with TNFα at different time points in the absence or presence of ROCK inhibitor. d Same experiment as in C from cells pretreated for 16 h with the proteasome inhibitor MG132. e Quantification of the relative levels obtained by densitometry analysis of the images of IκBα and ubiquitinated P-IκBα from the experiments shown in C (upper panel) and D (lower panel). The average and standard deviation values from three independent biological replicates performed are shown. f Quantification of the number of cells obtained after 96 h of culture in the indicated conditions. In all experiments n.s. non-significant; * p < 0.05; ** p < 0.01, and *** p < 0.001 obtained by two-sided t-test. In (f), & indicates synergy in the combination treatment (p < 0.05). Graphs represent the mean and s.d

