Fig. 3.
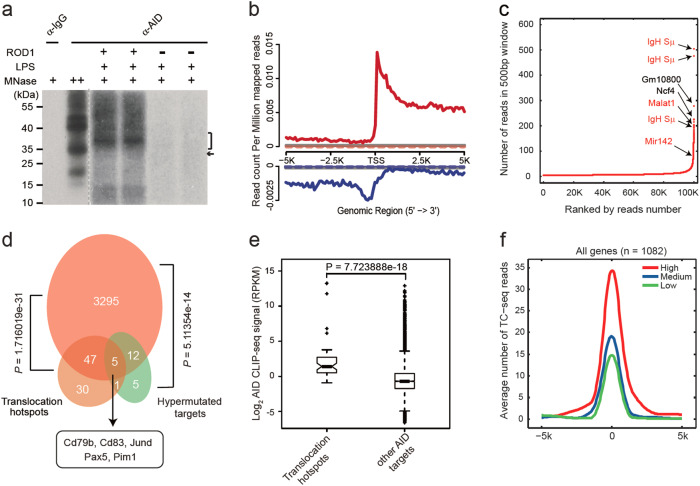
AID CLIP-seq in LPS-activated B cells. a Autoradiograph of 32P-labeled RNA cross-linked to AID. AID CLIP-seq was performed on LPS-activated B cells in the presence (+) or absence (−) of ROD1. RNA-protein complexes of 35 kDa under high micrococcal nuclease conditions corresponding to AID and short cross-linked RNAs (marked with an arrowhead). b AID read density from −5 kb to +5 kb of the TSS. The AID profile is shown as either solid or dashed lines based on the presence or absence of ROD1. The IgG profile is shown as gray line. The upper panel is the signal for the Watson strand (red), whereas the bottom panel is for the Crick strand (blue). c AID target ranking based on CLIP-seq binding strength. AID CLIP-seq signals are ranked by the number of unique reads in a 500-bp window. The top hits of several reported AID targets are marked by arrowheads and labeled in Red. d Venn diagram showing overlapped genes between AID CLIP-seq targets, chromosomal translocation hotspots and somatic hypermutation targets. P values were calculated by Fisher’s exact test. e Enrichment of AID CLIP-seq reads among translocation hotspots in LPS-activated B cells. The comparison is performed between 52 translocation hotspot genes and 3,307 other AID targets. P value was determined by Wilcoxon rank-sum test. f AID-binding profiles around the center of the translocation hotspots from −5 kb to +5 kb for all the TC-seq detected genes in B cells. TC-seq detected genes (n = 1082) were subgrouped into low, medium, or high based on the AID CLIP-seq signals

