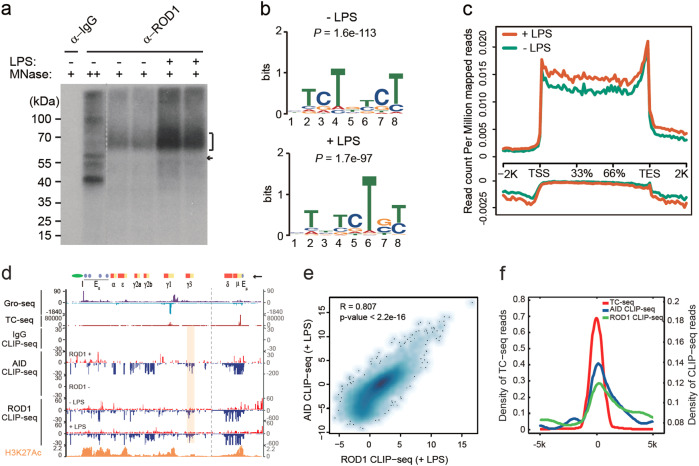
Fig. 4.
ROD1 and AID CLIP-seq signals are highly correlated. a Autoradiograph of 32P-labeled RNA cross-linked to ROD1. A single RNA-protein band of 57 kDa under high micrococcal nuclease conditions corresponding to ROD1 and short cross-linked RNAs (marked with an arrowhead). b Consensus motifs identified by CLIP-seq in naive or LPS-activated B cells. c ROD1 CLIP-seq read density around the TSS, gene body, 3′end and intergenic regions. The upper and bottom panels show the signals for the Watson and Crick strands, respectively. d Snapshot of Gro-seq, TC-seq, and CLIP-seq profiles at the IgH locus in B cells stimulated with LPS or not. Above, the IgH locus is annotated with the S-regions (yellow) and C-regions (red boxes) as well as the 5′ μ-chain enhancer (Eμ), 3′ α-chain enhancer (Eα), and insulator (I). The arrowhead indicates the transcription direction. The gray dash line separates the IgH locus into two parts with different y-axis scales. The AID and ROD1 bindings at γ3 are labeled by the pink box. e The correlation analysis of AID and ROD1 CLIP-seq in LPS-activated B cells. Scatter plots represent log2-normalized RPKM values of Refseq genes between the two datasets. The P value and R (Pearson’s correlation efficient) are indicated. f The CLIP-seq profile of AID and ROD1 around the center of the translocation positions detected by TC-seq

