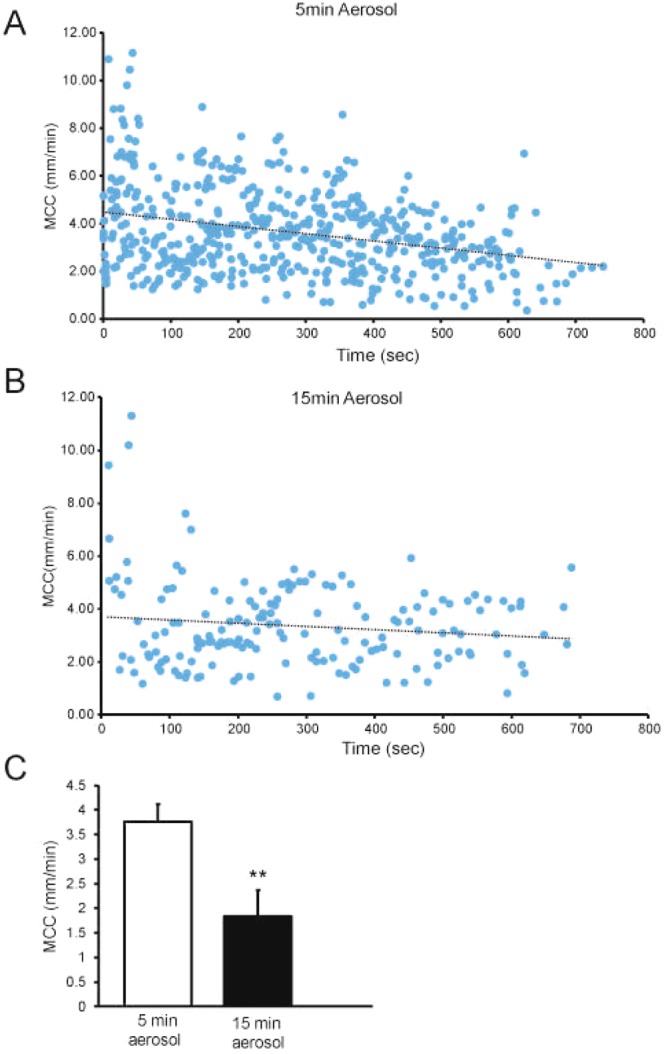
Figure 2.

(A) Mucociliary clearance measured over ~10-min period after aerosolization of beads for 5 min. Data are from 21 mice. r = −0.305, p = 0.001 (MCC vs Time). (B) Mucociliary clearance measured over ~10-min period after aerosolization of beads for 15 min, 12 mice were studied. Data from 5 mice in which all beads were plaqued to the tracheal wall, thus exhibiting no MCC, are not plotted. r = −0.0130, p = 0.09. (C) Mean MCC rates from mice aerosolized for 5 or 15 min. When non-mobile rafts were observed, they were not included in the mean rate of MCC. However, if no mobile rafts were observed, as was the case for some of the mice receiving aerosol for 15 min (see below), the mean rate of MCC of these mice was included in the average as zero. In all studies, mean data were calculated by determining the average rate of MCC for each mouse and then averaging data for all mice. Mean data in all figures are +/− SEM. **p = 0.001.
