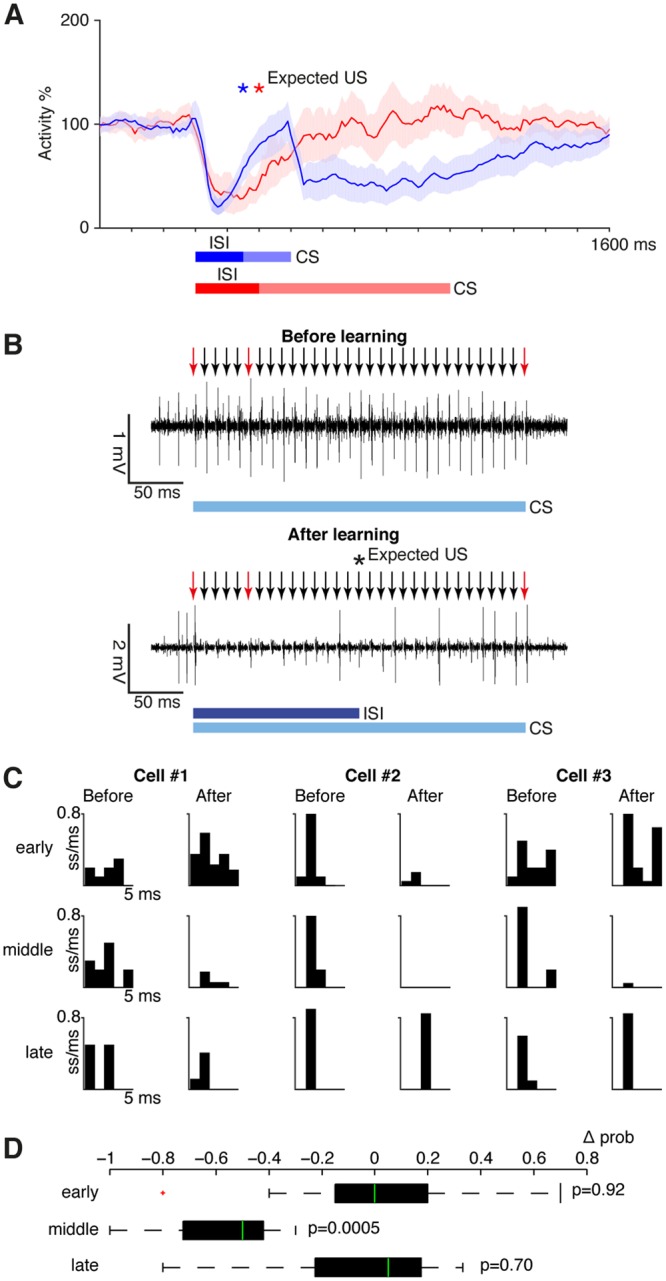
Figure 2.

Effects of conditioning on Purkinje cell responses to parallel fibre input. (A) Conditioned responses on CS only trials after training with either a 150 ms interstimulus interval (blue, n = 7, CS duration: 300 ms) or a 200 ms interstimulus interval (red, n = 5, CS duration: 800 ms). Traces show smoothed and averaged simple spike activity over 20 trials ± SEM as a percentage of background activity. ISI, interstimulus interval (between onset of the first CS pulse and the expected US). See ref.8 for full details on these conditioned responses. (B) Sample records of a Purkinje cell’s response to the CS alone before and after learning. Arrows indicate the timing of CS pulses. The red arrows indicate those pulses that were selected for analysis. (C) Post stimulus time histograms showing spike probability in three sample cells. These cases illustrate the variability between cells. (D) Boxplot showing the average change (Δ prob) in spike probability in all cells for the three selected stimulus impulses (median, 75th and 25th percentiles, maximum and minimum data points not considered outliers and one outlier, defined as 1.5 quartile ranges below the first quartile, marked as ‘+’). P values indicate Wilcoxon matched-pairs signed rank tests mentioned in text.
