Figure 5.
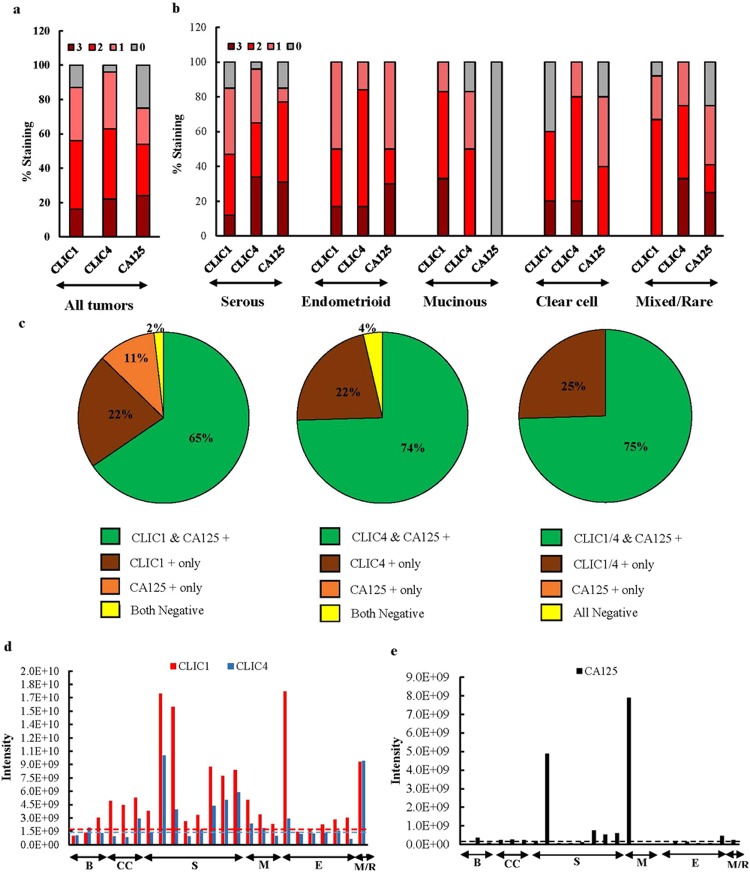
Sensitivity of CLIC1 and CLIC4 as EOC biomarkers. Intensity of CLIC1, CLIC4 and CA125 staining across all tumors (a) and tumors of each EOC subtype (b). (c) Complementarity among CLIC1, CLIC4, and CA125 staining. (d) Quantitation of CLIC1 and CLIC4 shed from benign and malignant ovarian tumors expressed as protein intensity; B = Benign (n = 3), CC = Clear cell (n = 3), S = Serous (n = 8), M = mucinous (n = 3), E = Endometrioid (n = 6), M/R = Mixed/Rare (n = 1). The red (1.8E + 9) and blue (1.4E + 9) horizontal lines indicate the average secretion of CLIC1 and CLIC4, respectively, from the benign tumors. (e) Quantitation of CA125 from the same secretomes as in panel d. Black horizontal line (1.5E + 8) indicates the average CA125 shed from the benign tumors.

