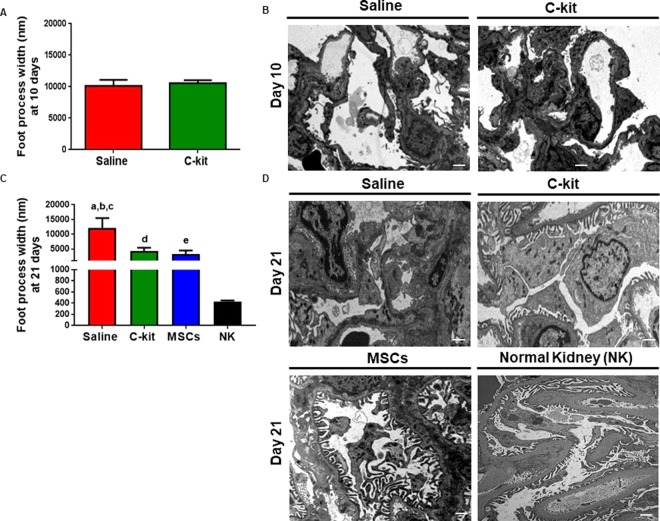
Figure 2.
Progenitor/stem cell therapy restores foot process effacement. (A) Foot process width (FPW) was not different between saline and c-kit treated groups at day 10. (B) Representative images of the transmission electron microscopy (TEM) for saline and c-kit treated animals at day 10 (n = 4 in each group). (C) FPW was lower in the c-kit (a, *P = 0.03) and MSC (b, *P = 0.047) treated groups when compared to the saline group at day 21 (n = 4 in each group). FPW was higher in the saline, c-kit and MSC-treated groups when compared to normal kidneys (c,d,e; all ****P < 0.0001, respectively). (D) Representative images of the transmission electron microscopy (TEM) for saline, c-kit, and MSC-treated animals at day 21 (n = 4 in each group) and normal kidney (NK, n = 3). All data are means ± SEM. Scale bars represent 2 μm for (B) and 1 μm for (D).

